You can find on this repository many charts and data about Coronavirus (COVID-19) disease, especially in Europe. Most of data come from CSSE (Johns Hopkins Center for Systems Science and Engineering), but I also add data of my own to have up-to-date data.
French data come frome INSEE (Institut National des Statistiques et des Études Économiques) and Santé Publique France.
For more information and comments in French, you can follow me on Twitter: @guillaumerozier.
Contents
- :fr: France: tous les graphiques
- Vue d’ensemble
- Hospitalisations et réanimations dues au Covid-19
- Décès dus au Covid-19
- Mortalité toutes causes
- :earth_africa: World: All Charts
- Confirmed cases of Covid-19
- Deaths caused by Covid-19
- Repository structure
- Data sources
???????? France: tous les graphiques
Only few charts are displayed here. You can download every chart in high definition here:
French Charts.
Nouveau : cliquez sur une image pour afficher une version interactive. Vous pouvez alors zoomer, et enlever des courbes en cliquant ou double-cliquant sur un élément de légende.
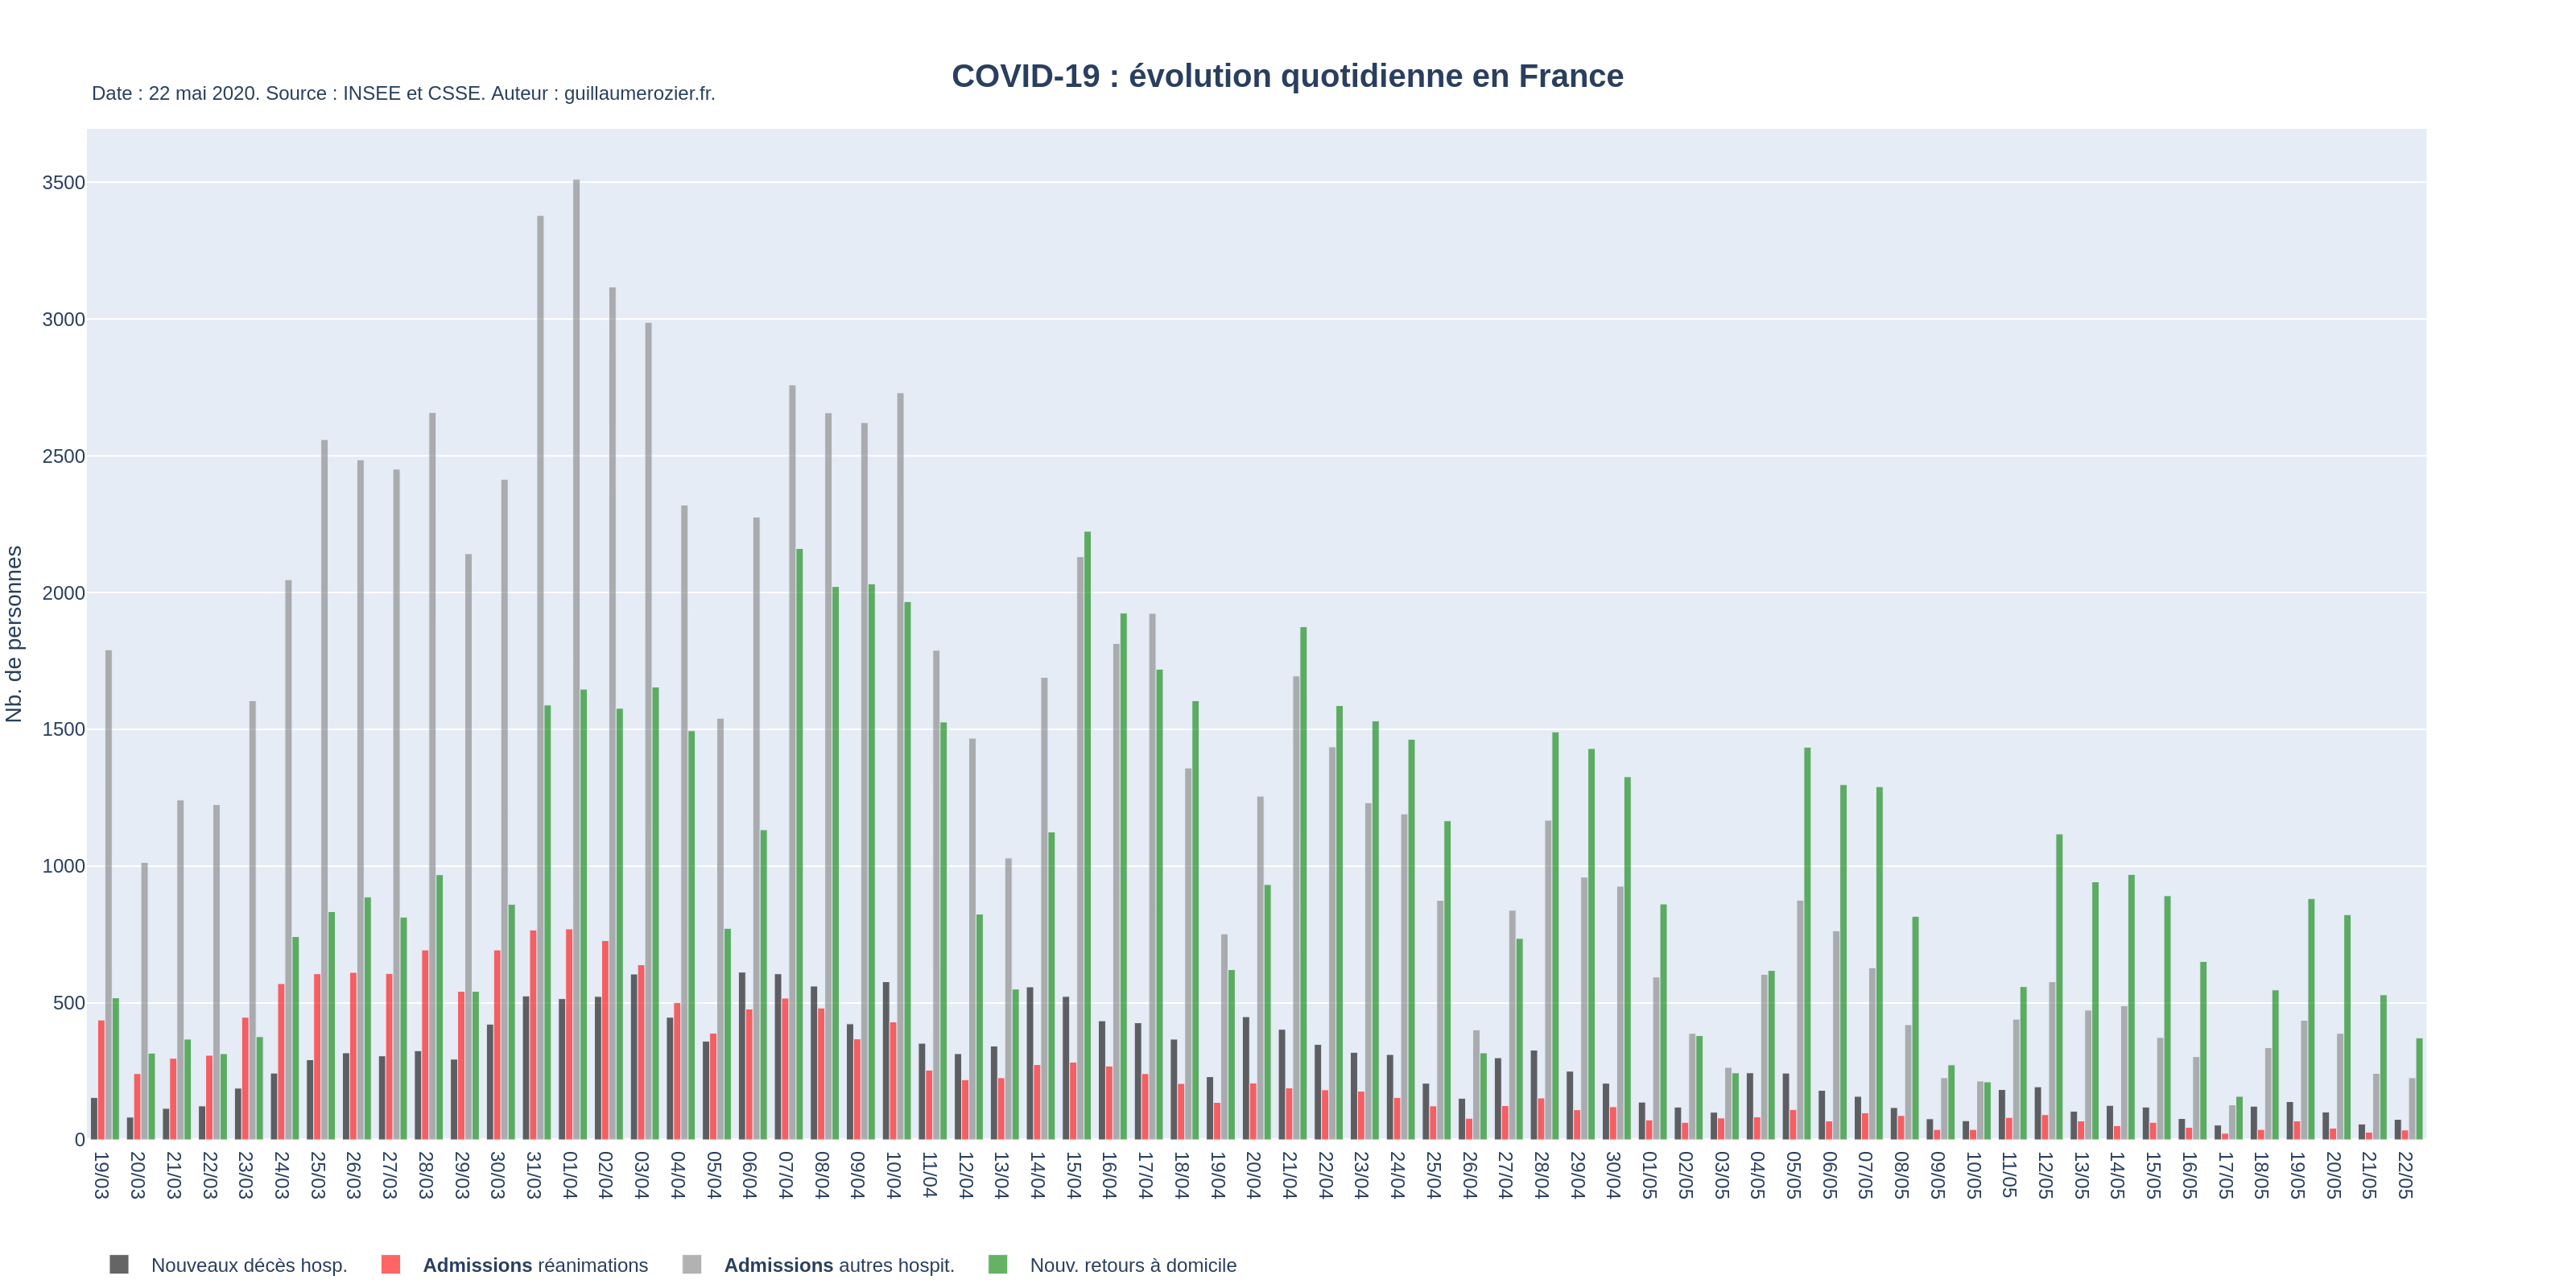
Vue d’ensemble
Autres graphiques :
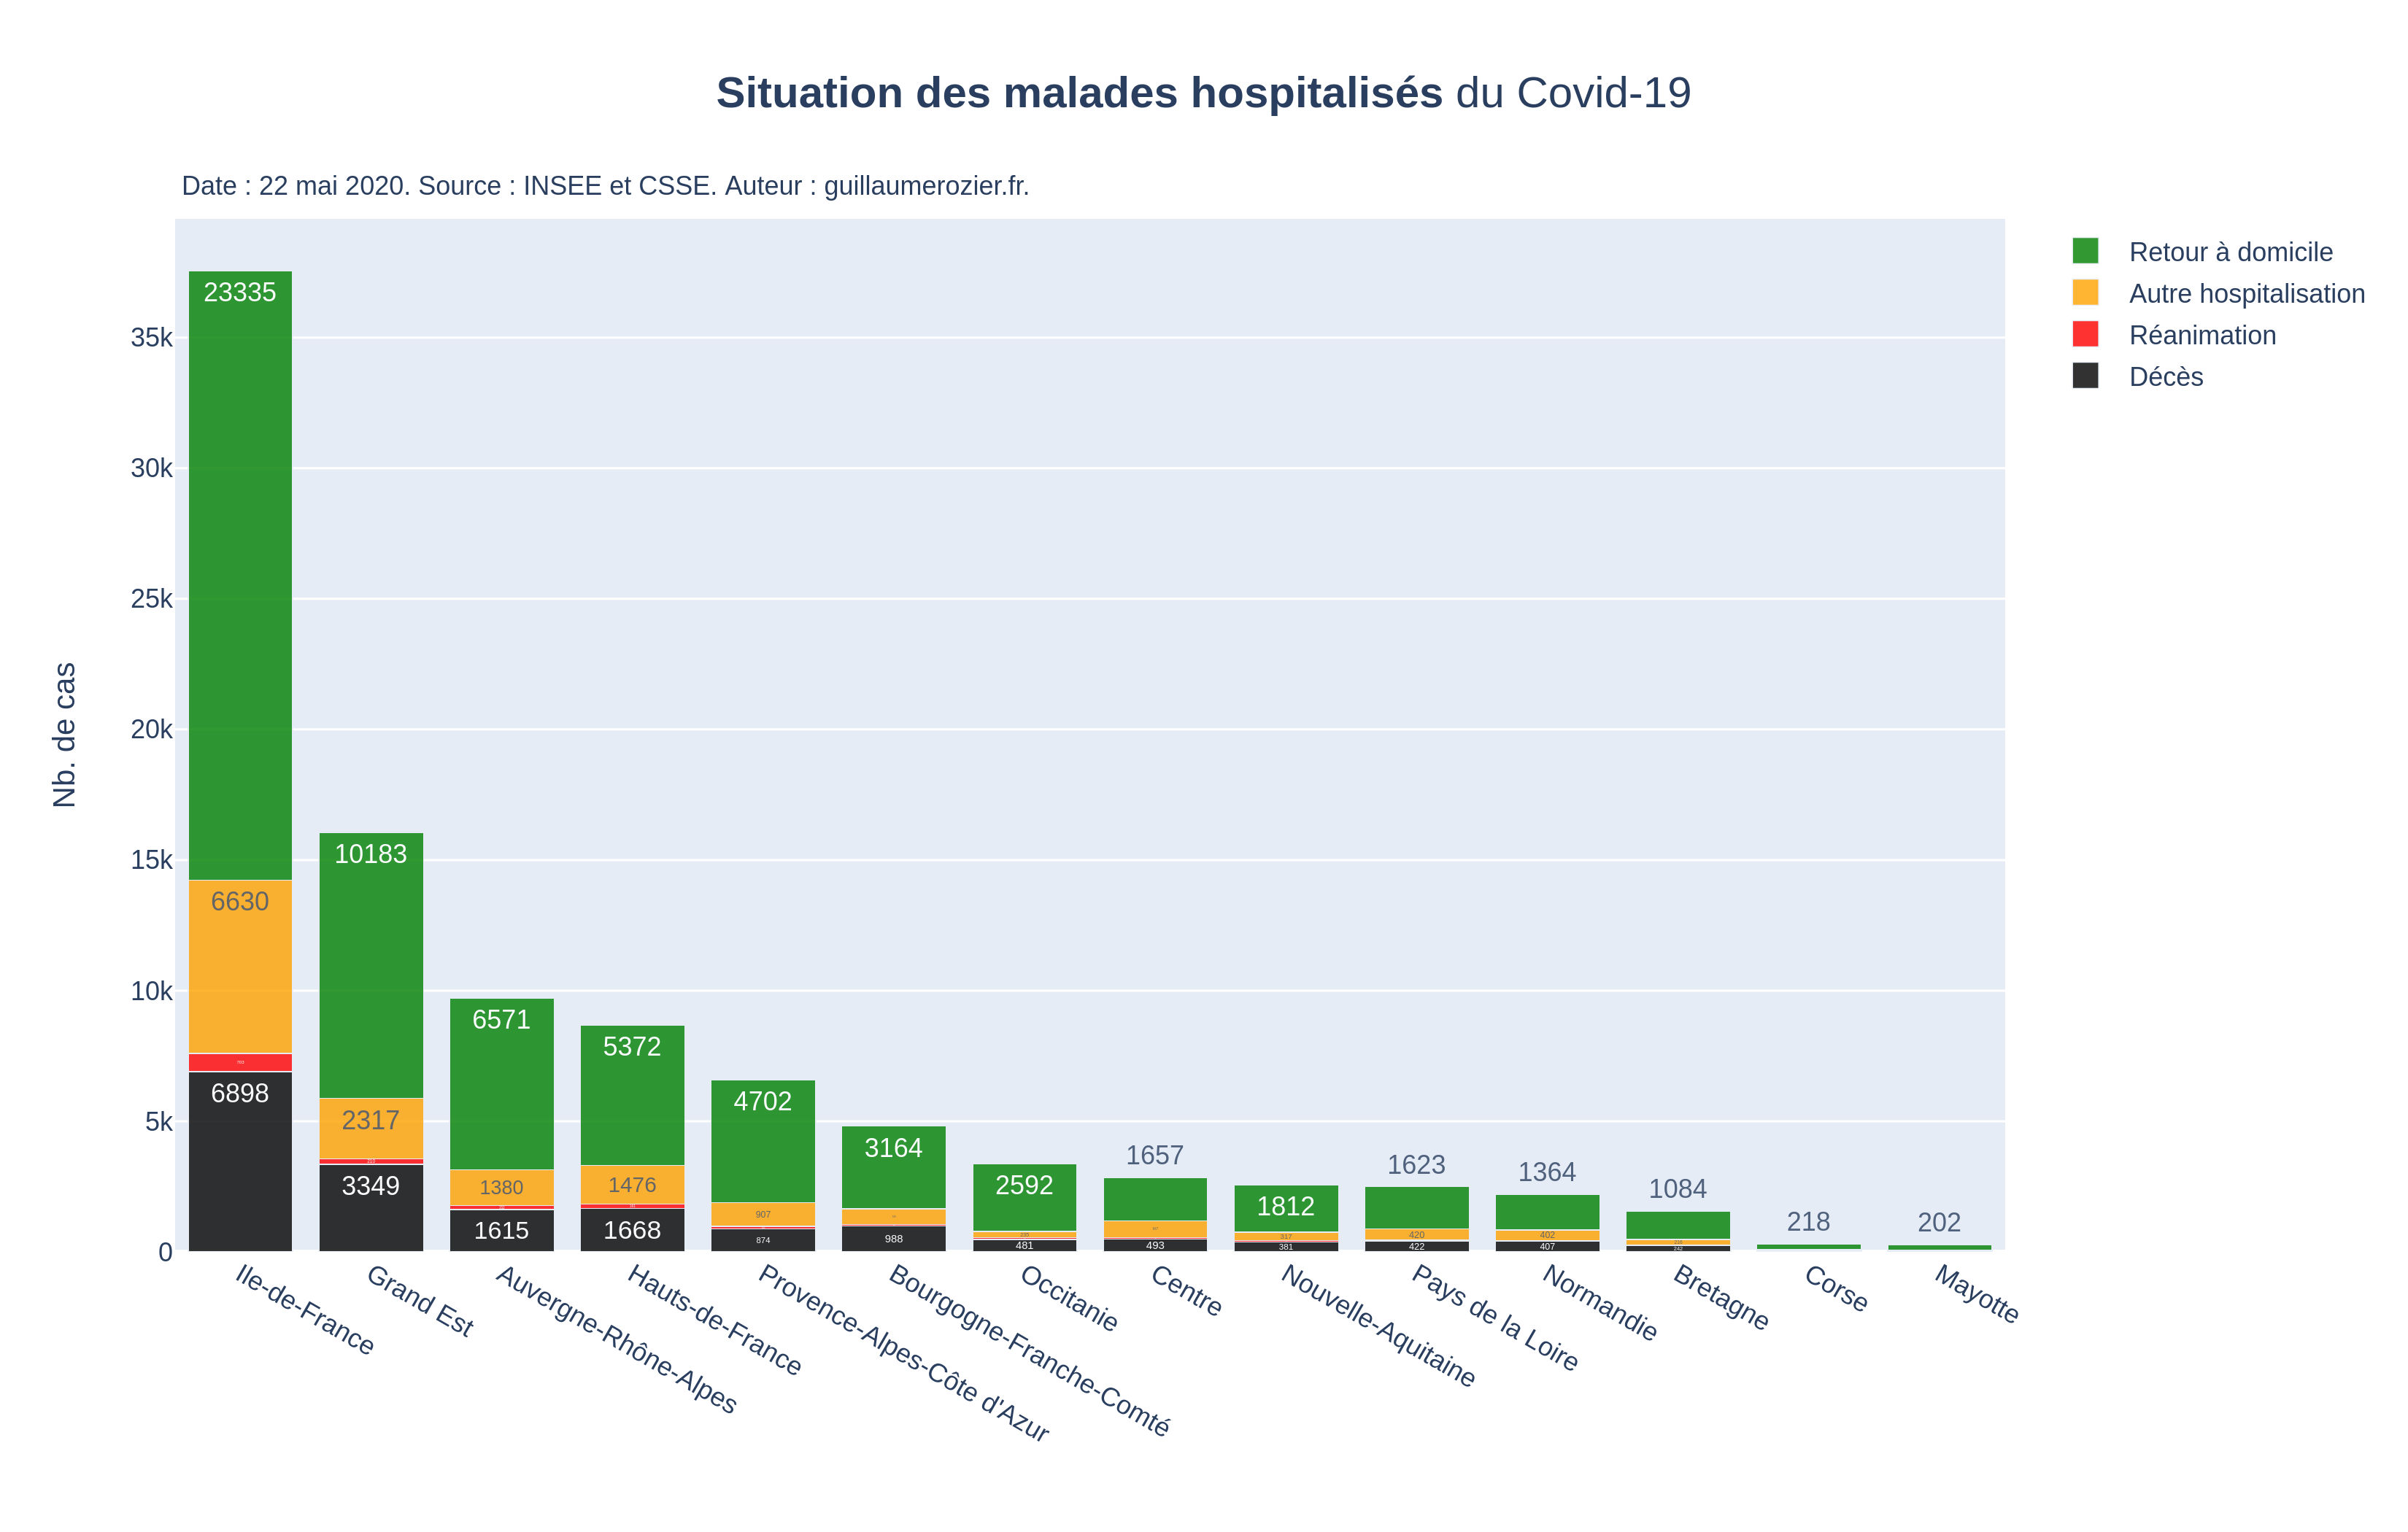
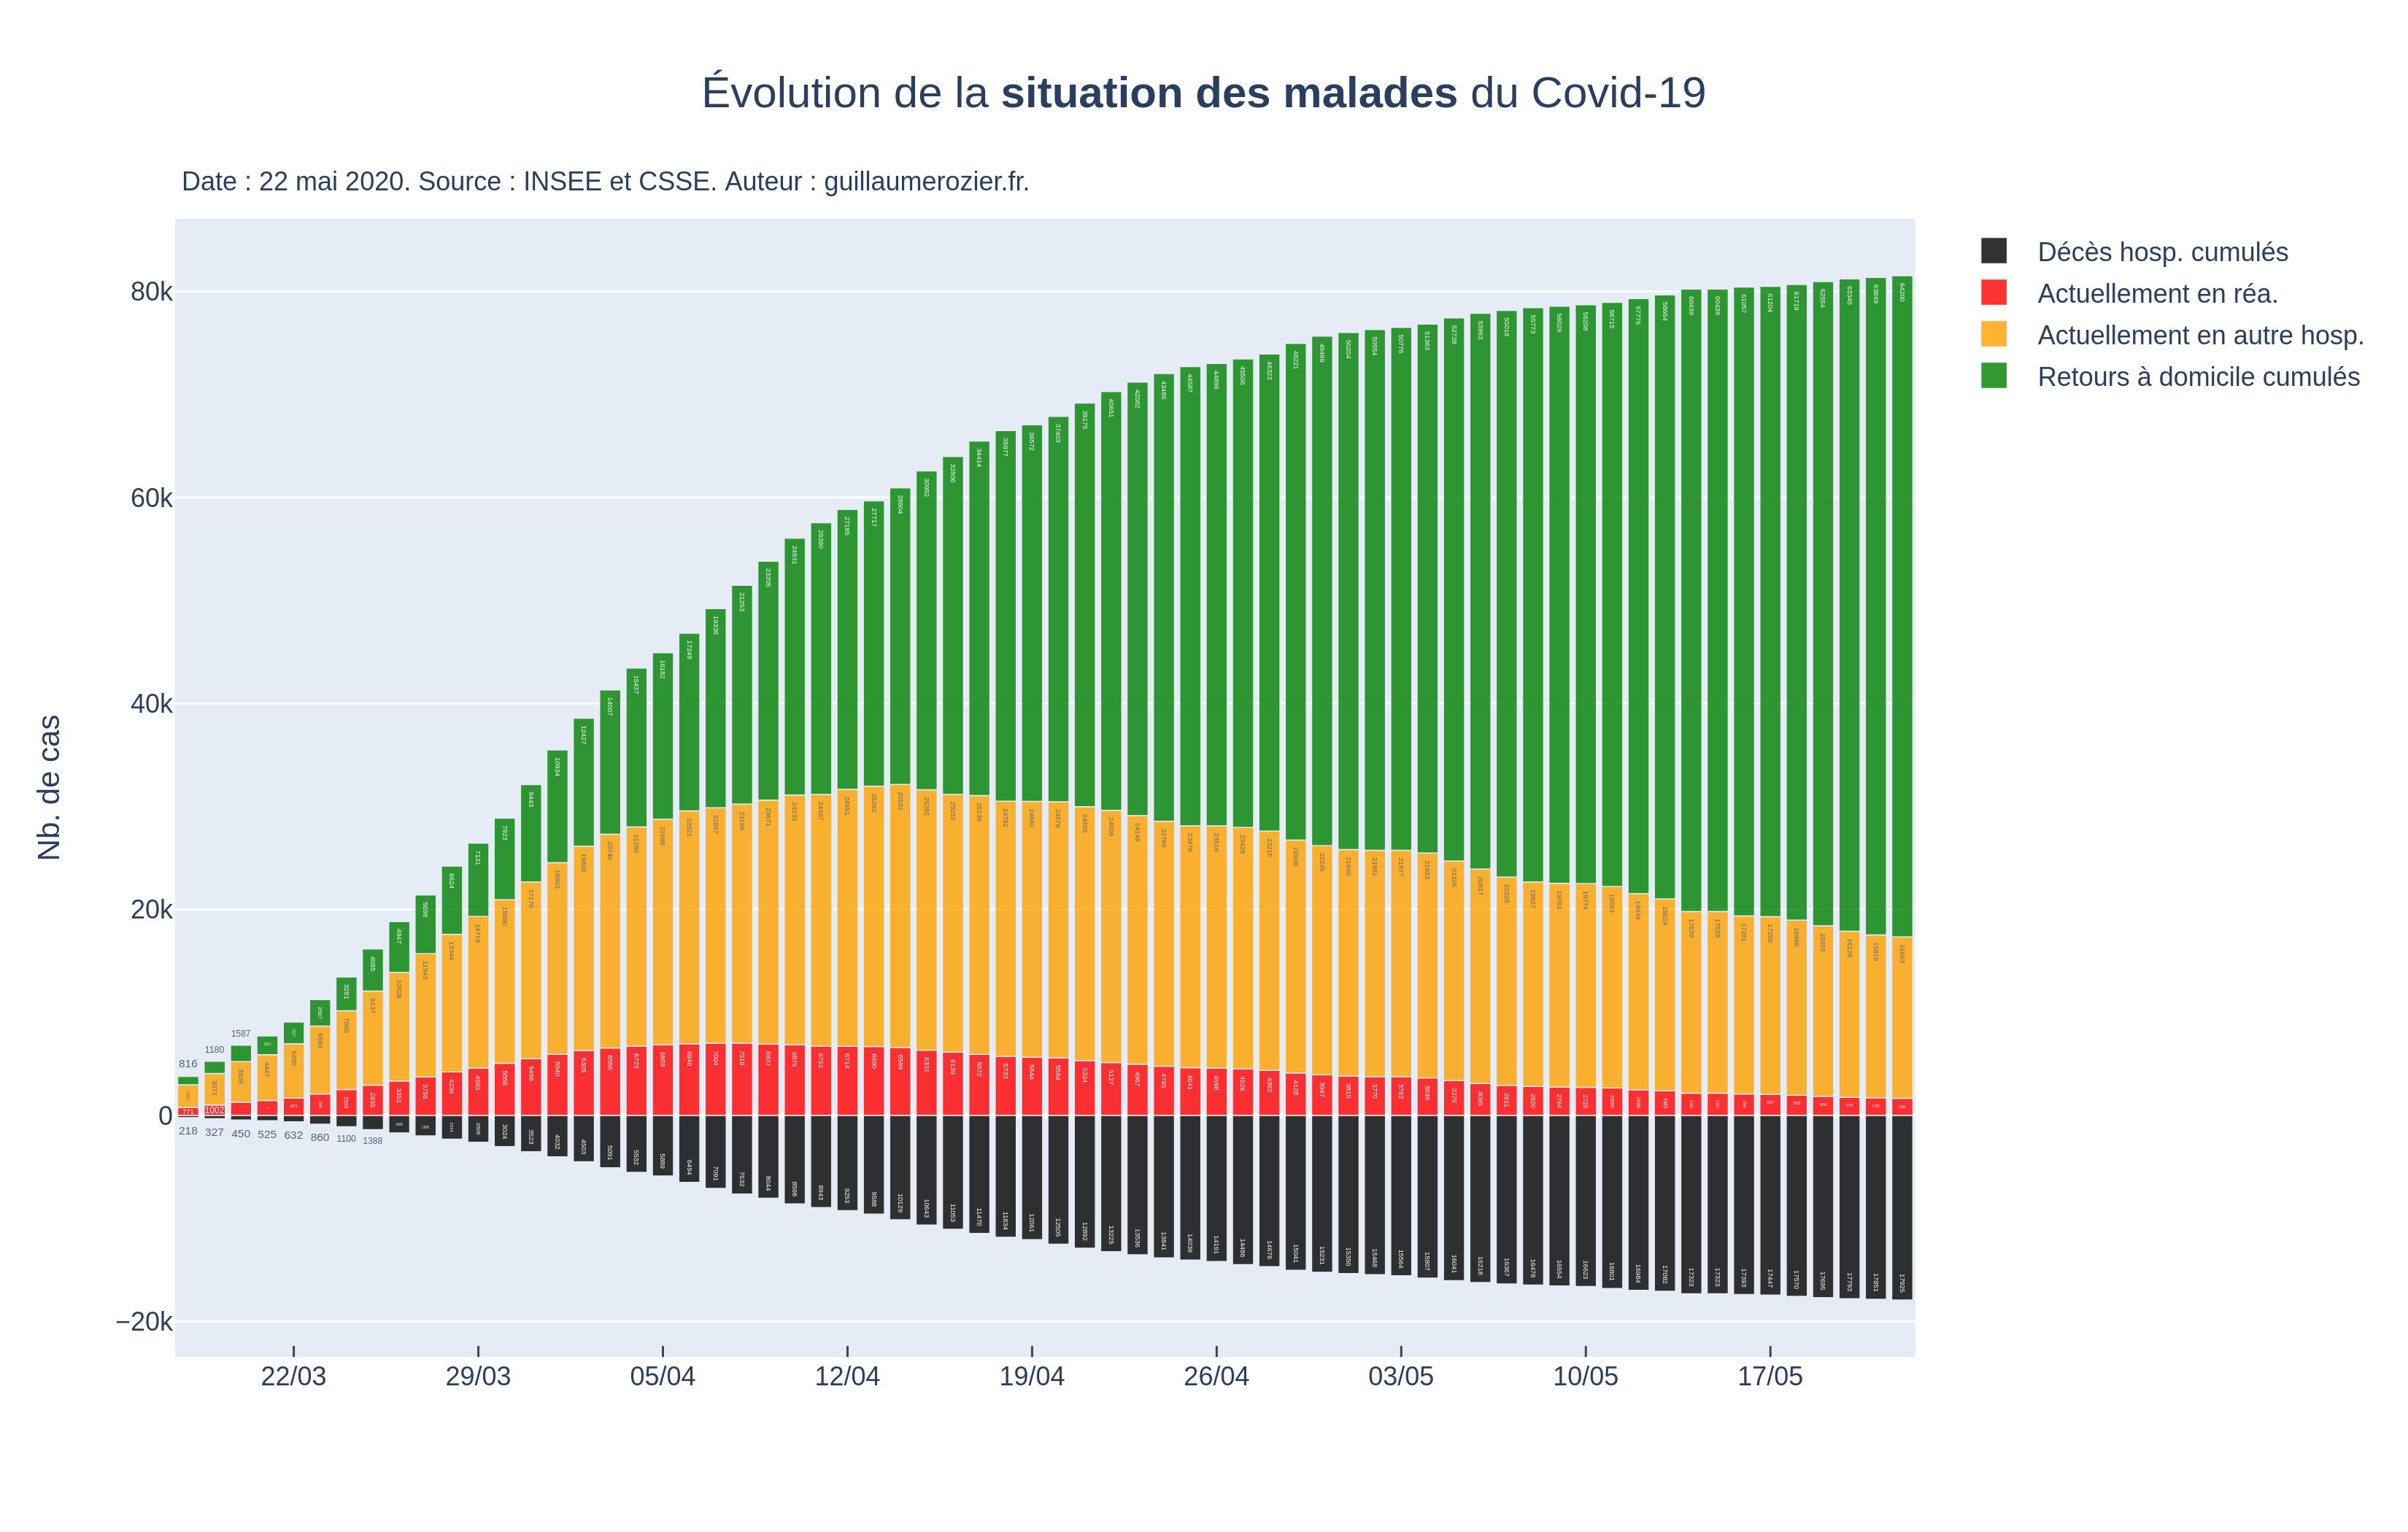
Hospitalisations et réanimations liées au Covid-19


Autres graphiques :


Décès dus au Covid-19

Autres graphiques :


Mortalité toutes causes
Please find the other charts here:
French charts.
Vous pouvez aussi me suivre sur Twitter pour des interprétations des graphiques.
???? World: All Charts
:bulb: TIPS:\
:chart_with_upwards_trend: Get interactive graphes by clicking on « Show Graph ».\
:bar_chart: Add or remove items in the legend by cliking or double-clicking on items.\
:mag_right: Zoom-in: draw a rectangle with your finger/mouse on the graph then release.\
:house: Reinitalize: double tap/click on the graph.
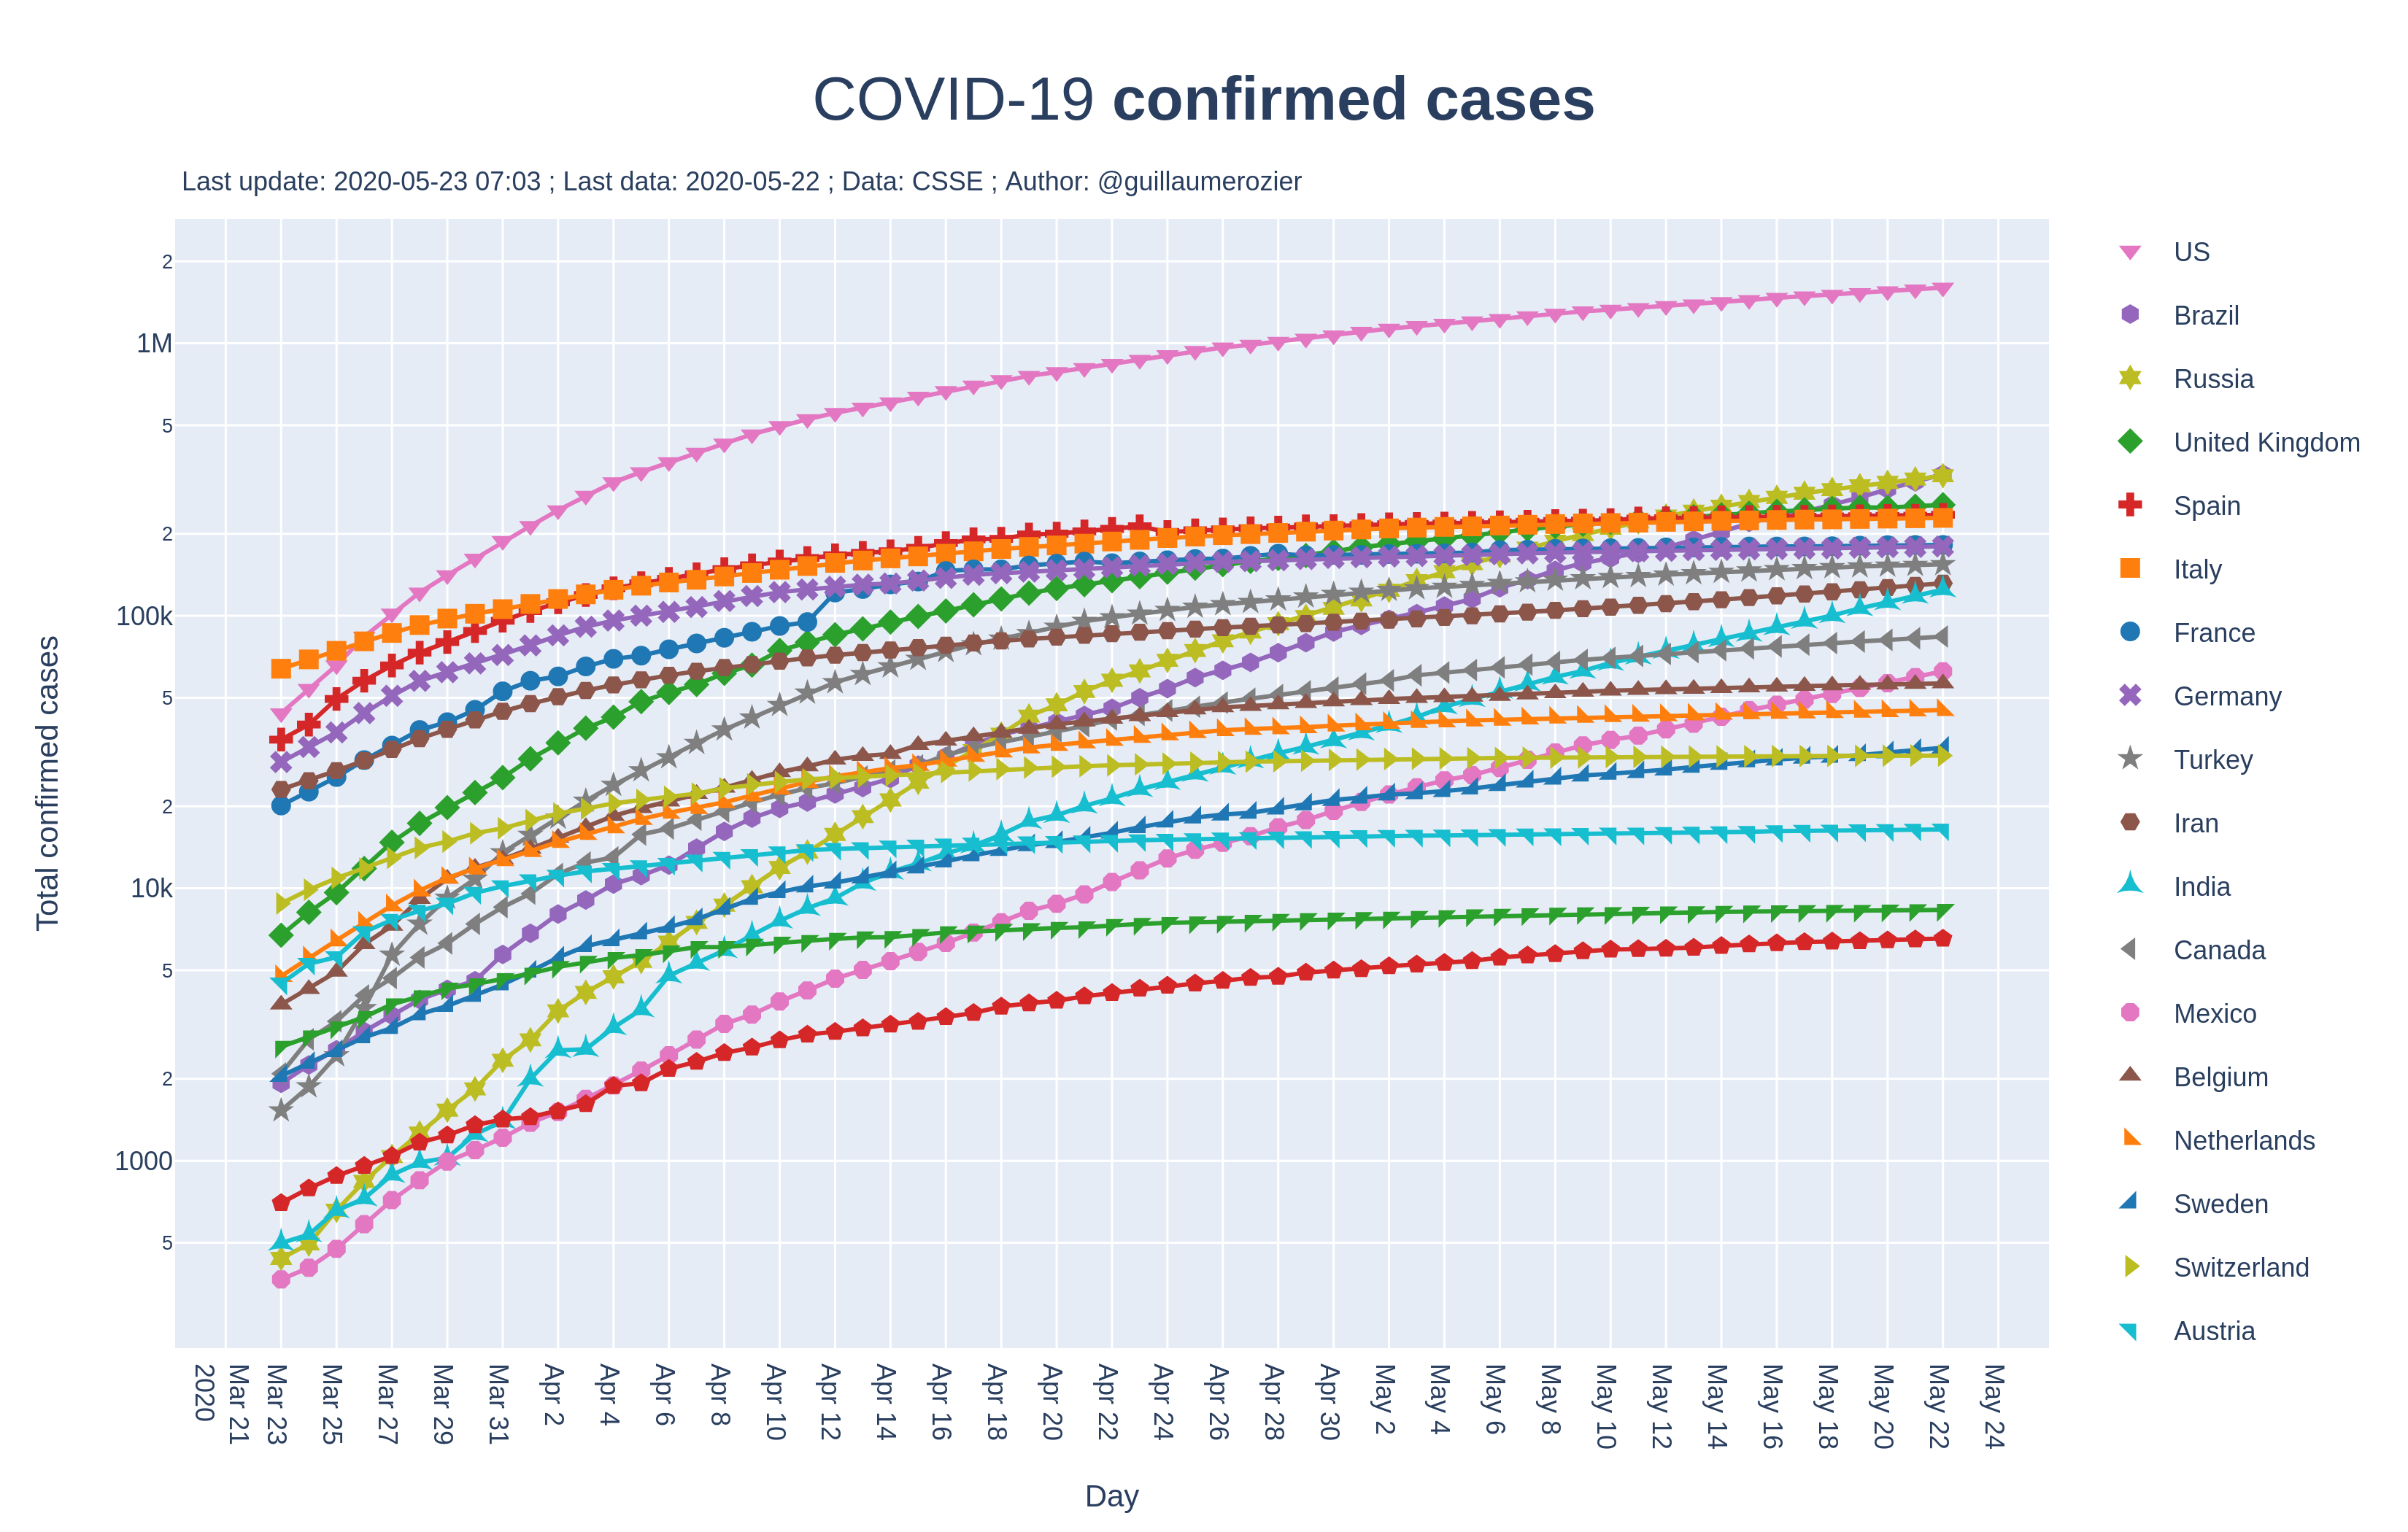
Confirmed cases of COVID-19
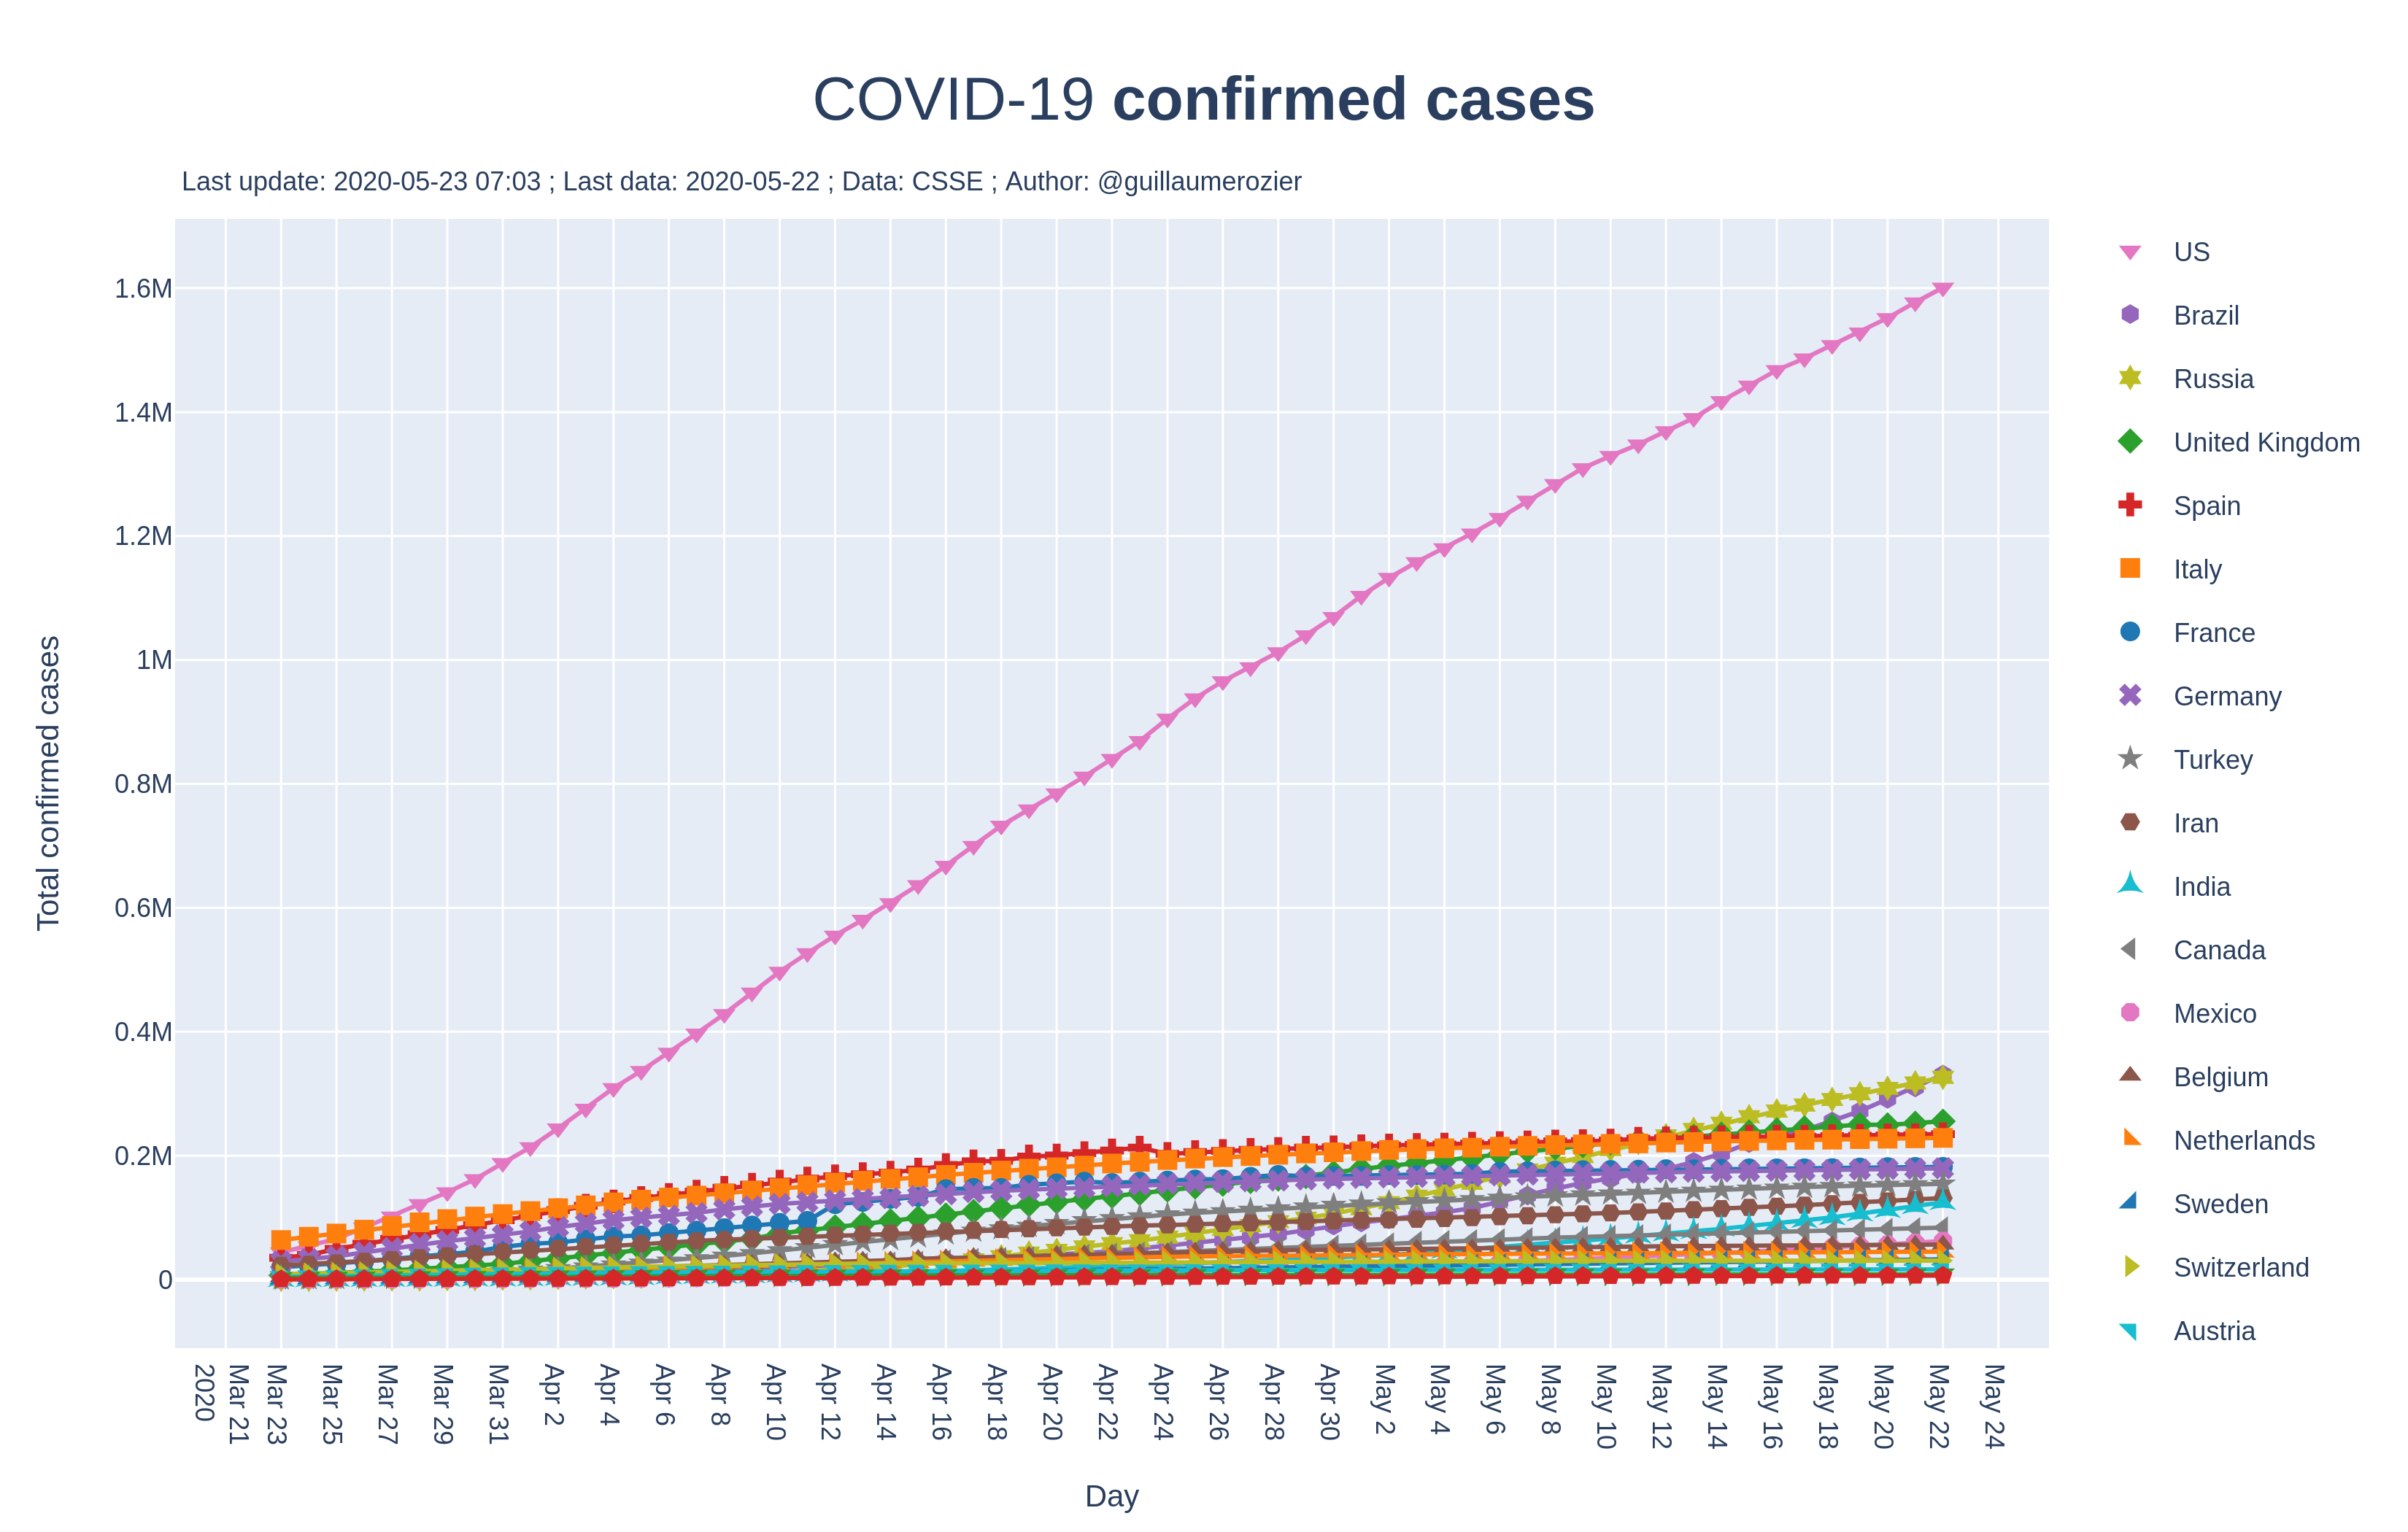
Confirmed cases\
:arrow_right: Show Graph • Graph (log.) • Image • Image (log.)\
This chart represents the total number of confirmed cases of COVID-19 against time, in days.
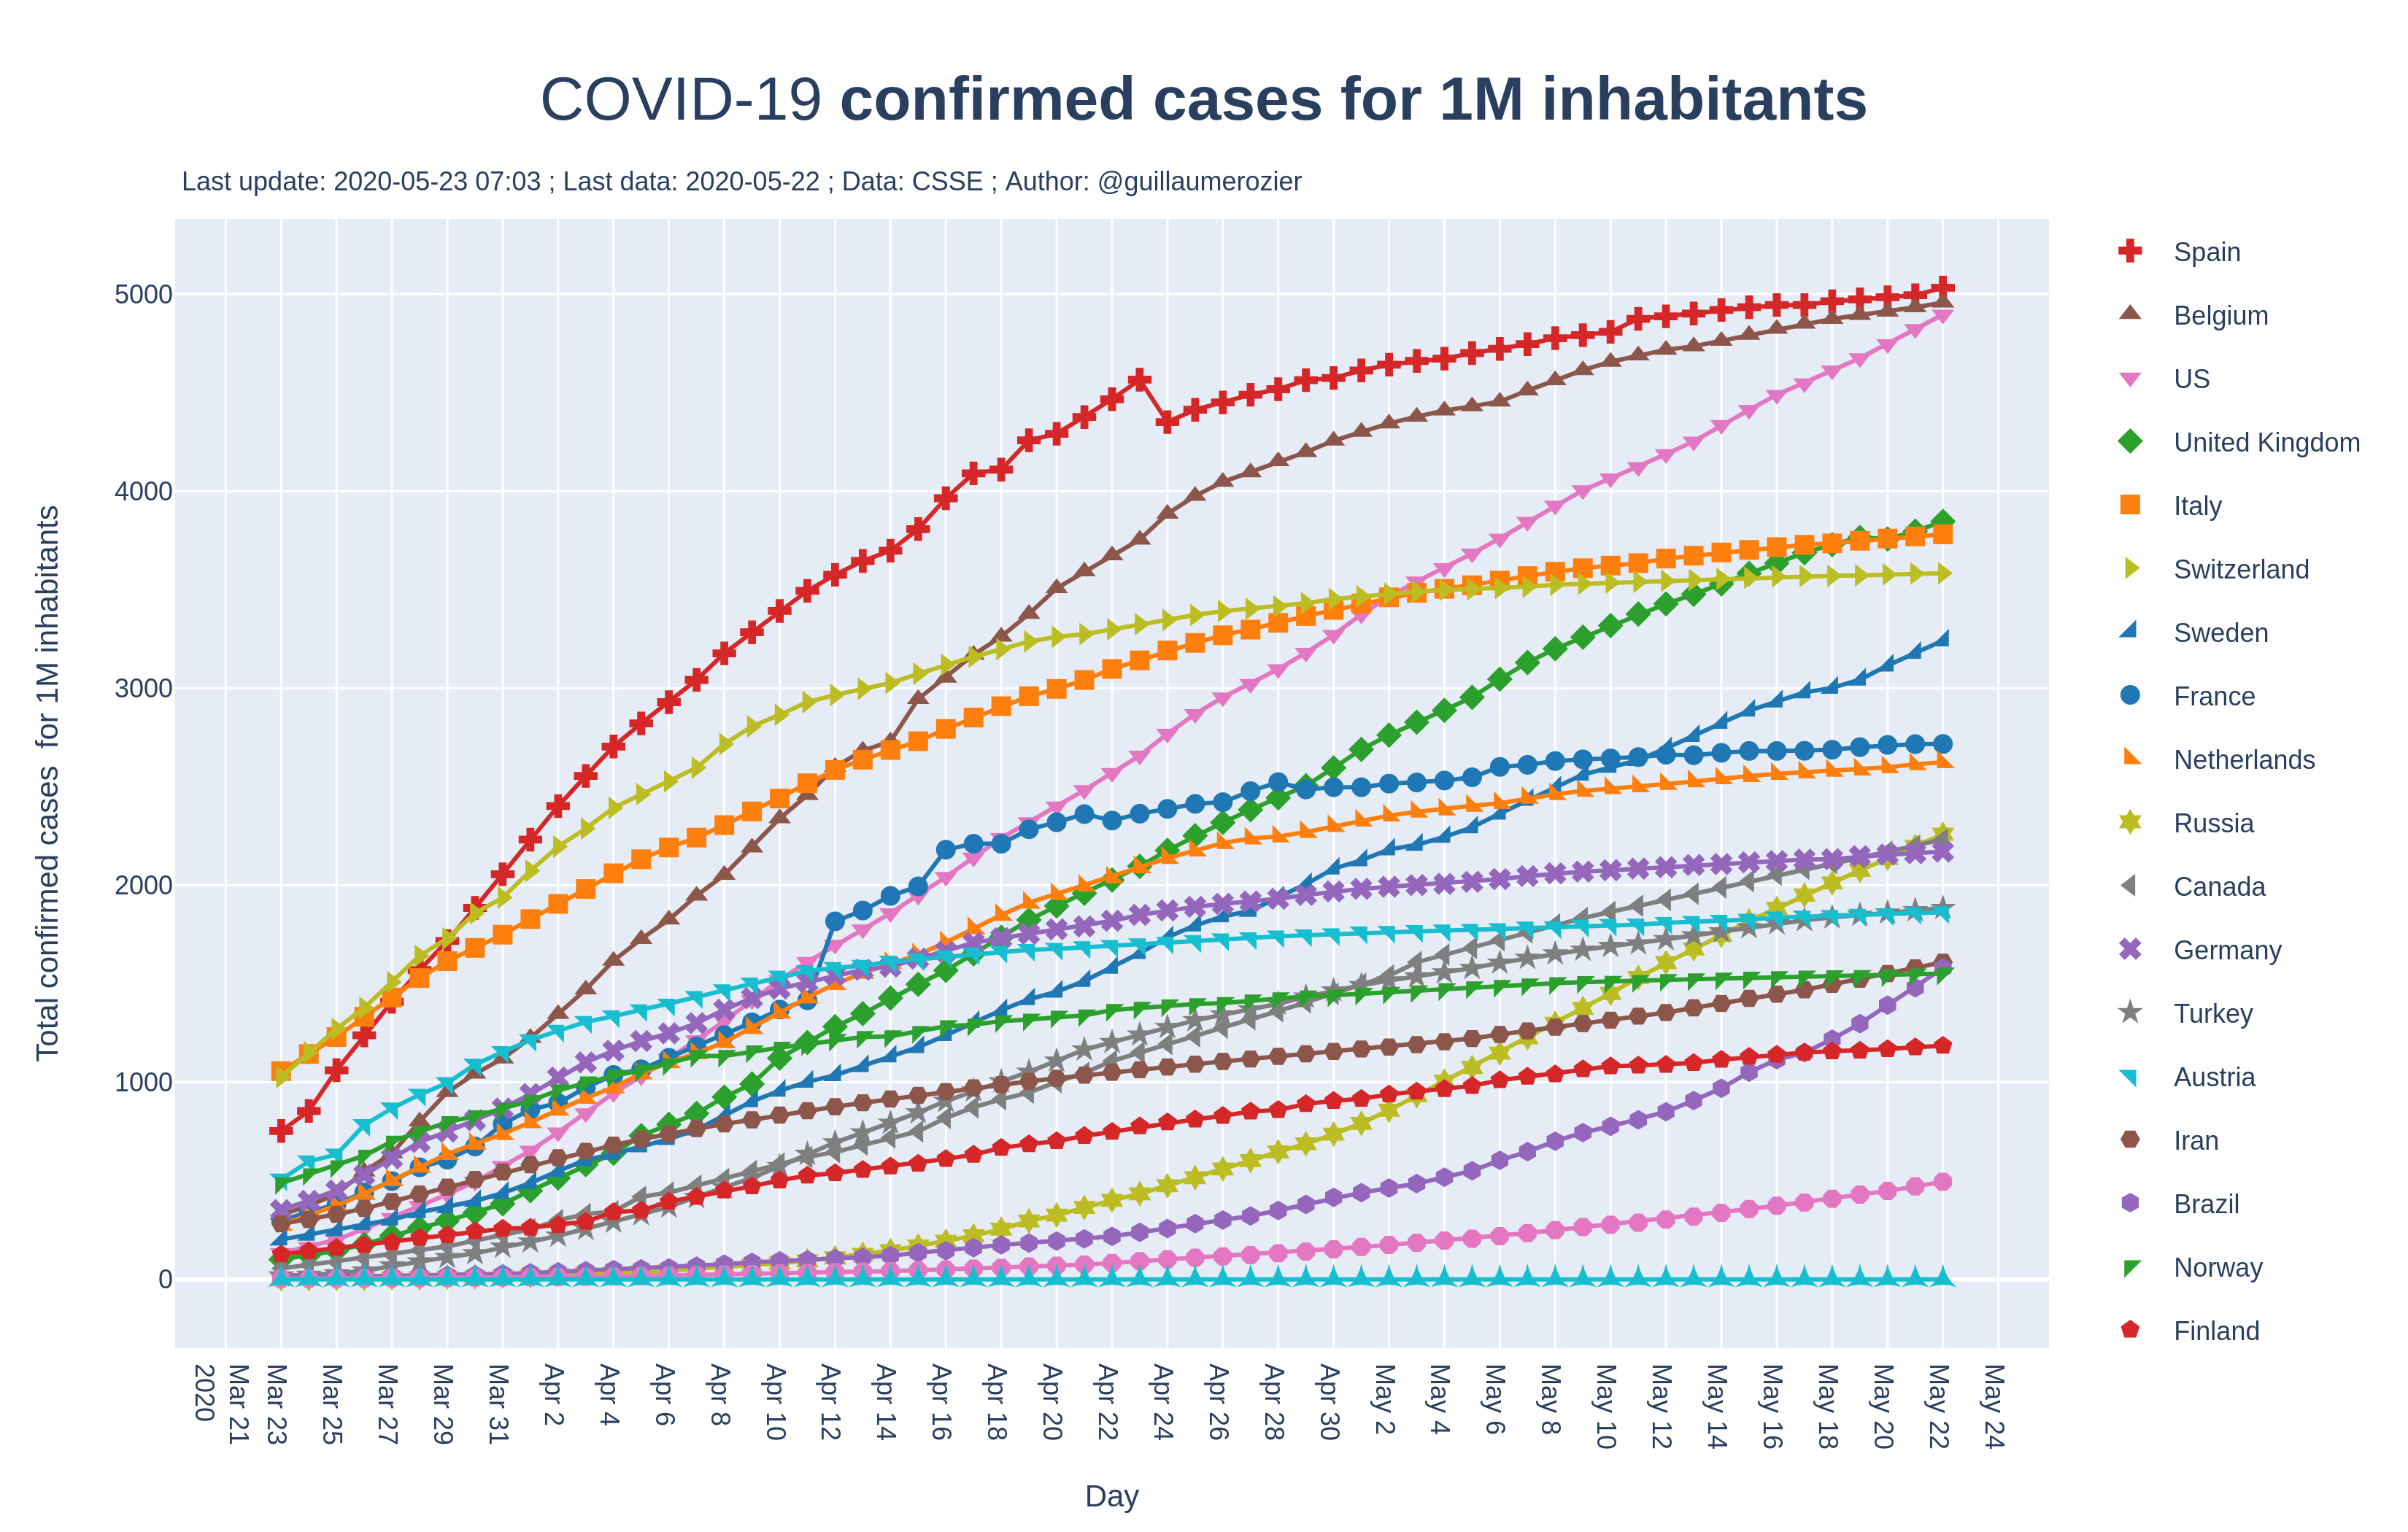
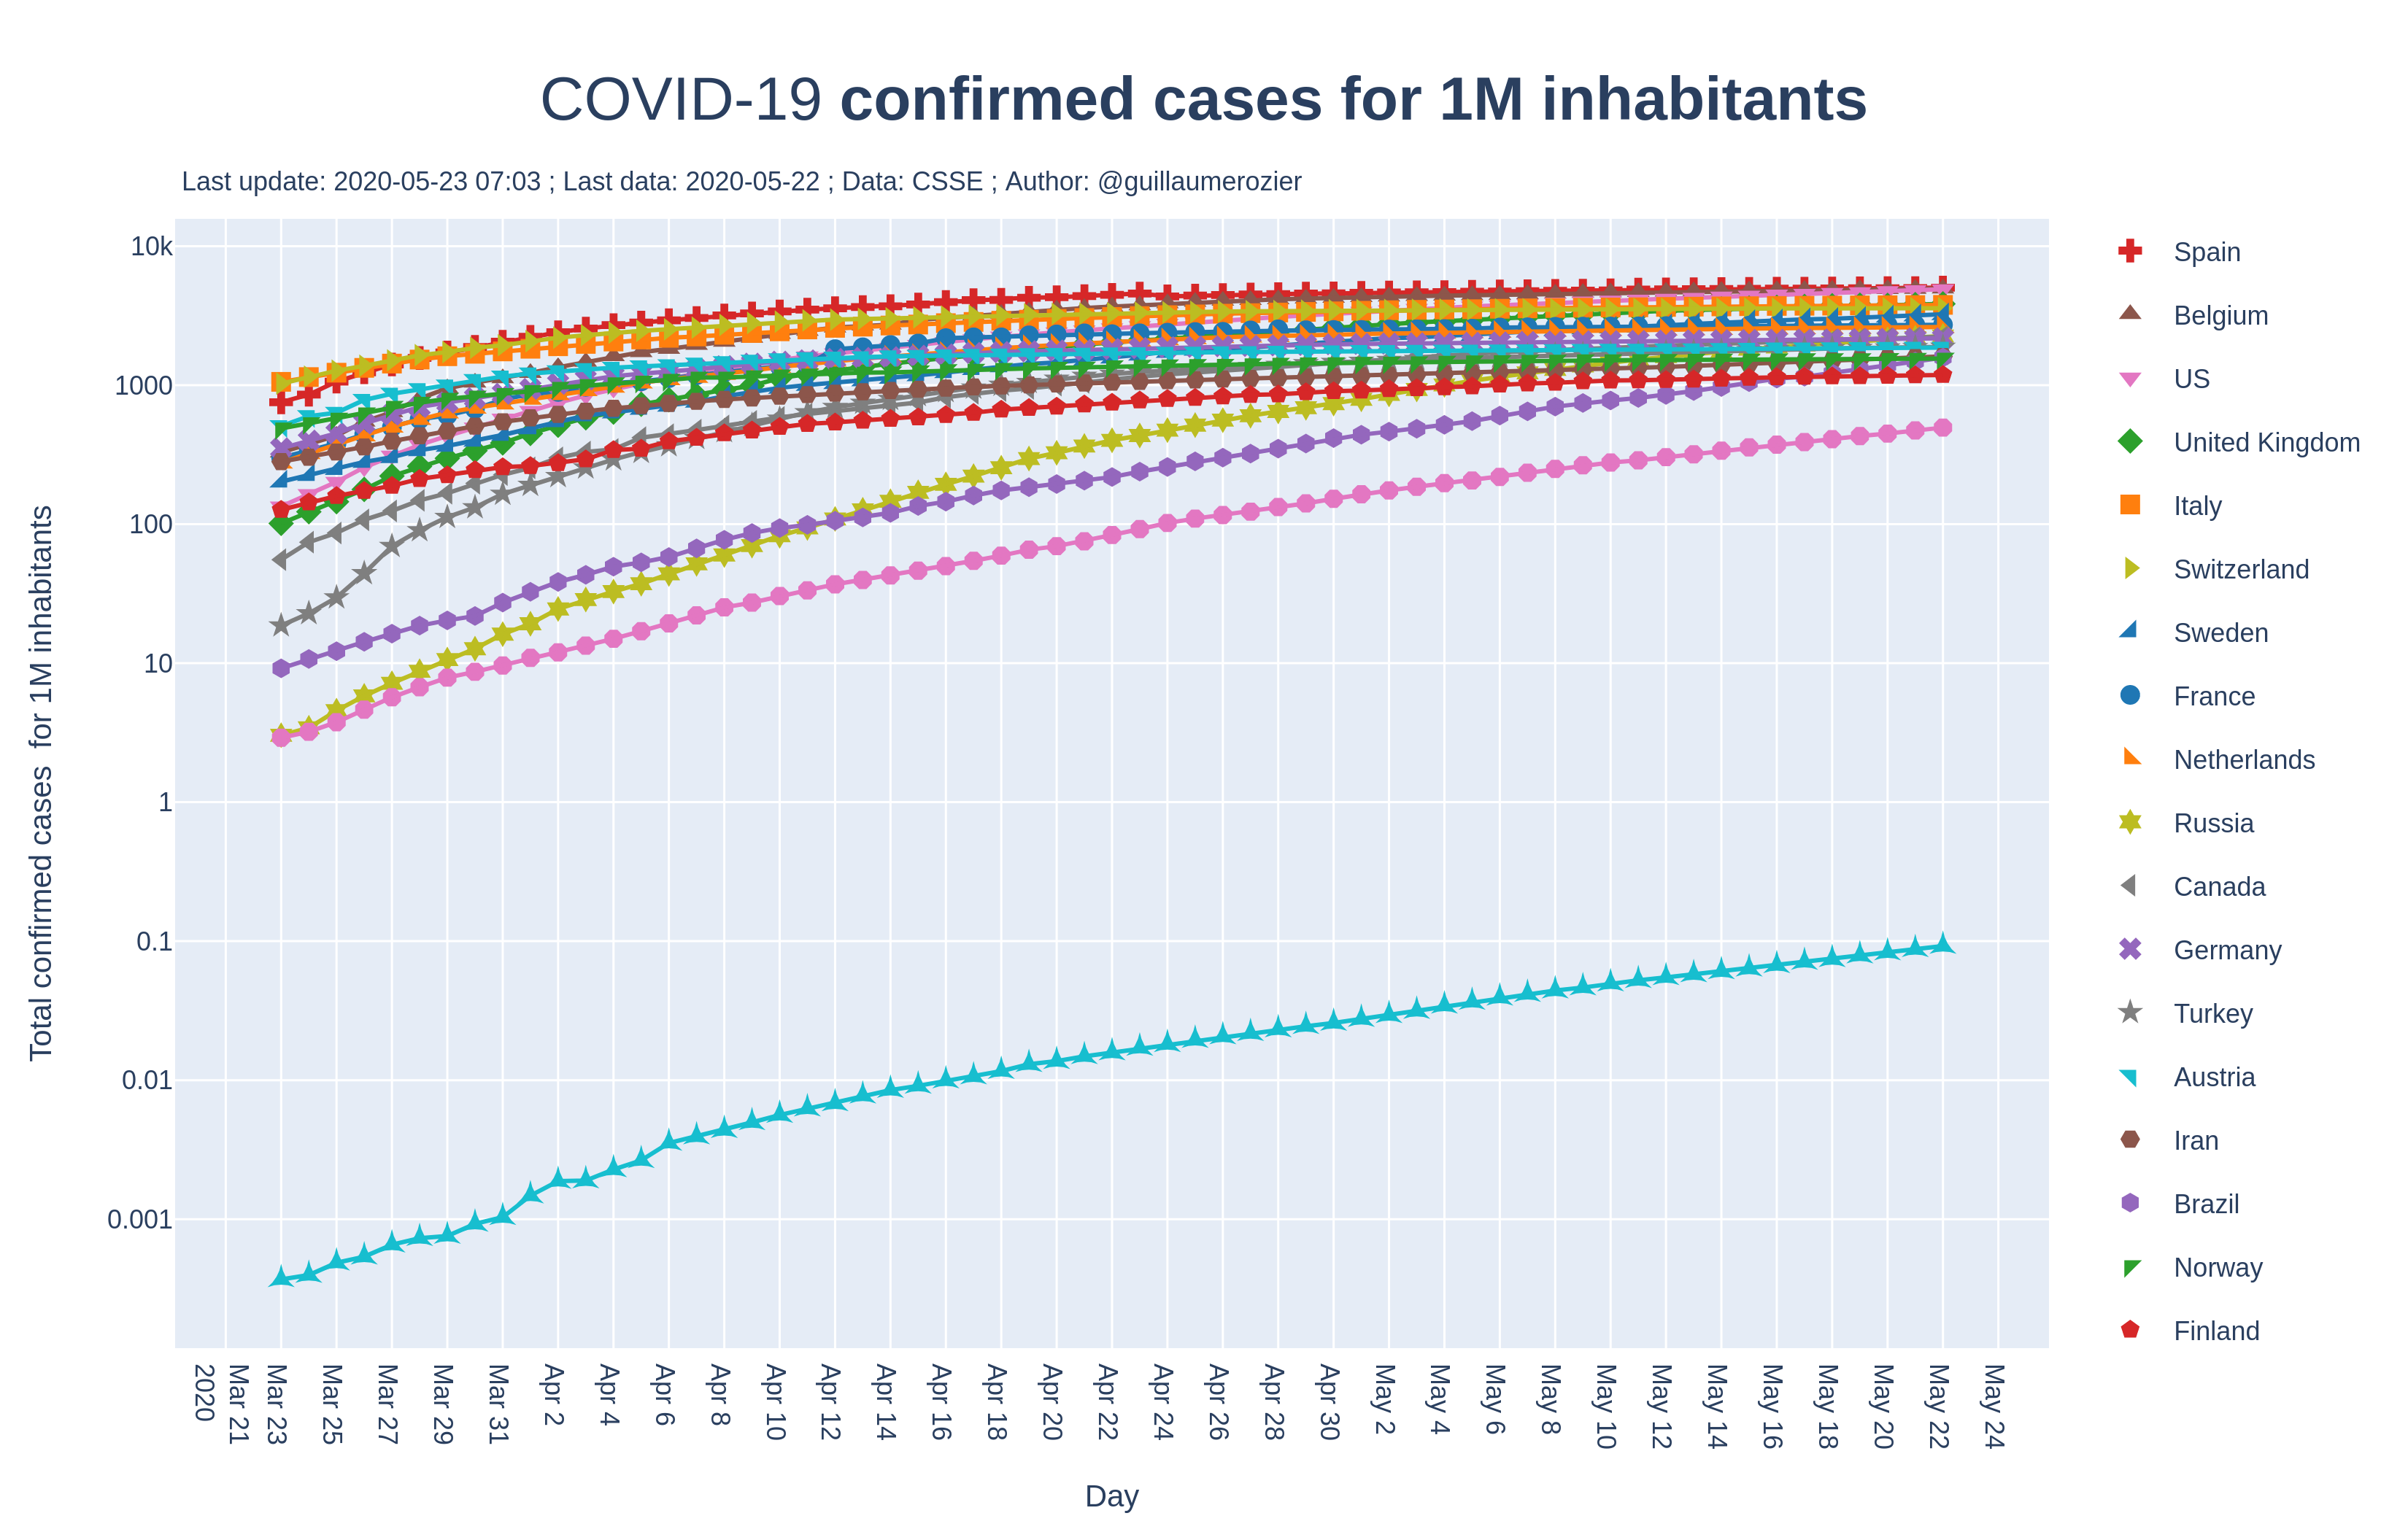
Confirmed cases for 1M inhabitants\
:arrow_right: Show Graph • Show Graph (log. scale) • Download Image • Download Image (log. scale)\
Same as the first one, but the number of cases is divided by the population of each country. So the plotted data is the number of confirmed cases for 1 million inhabitants.
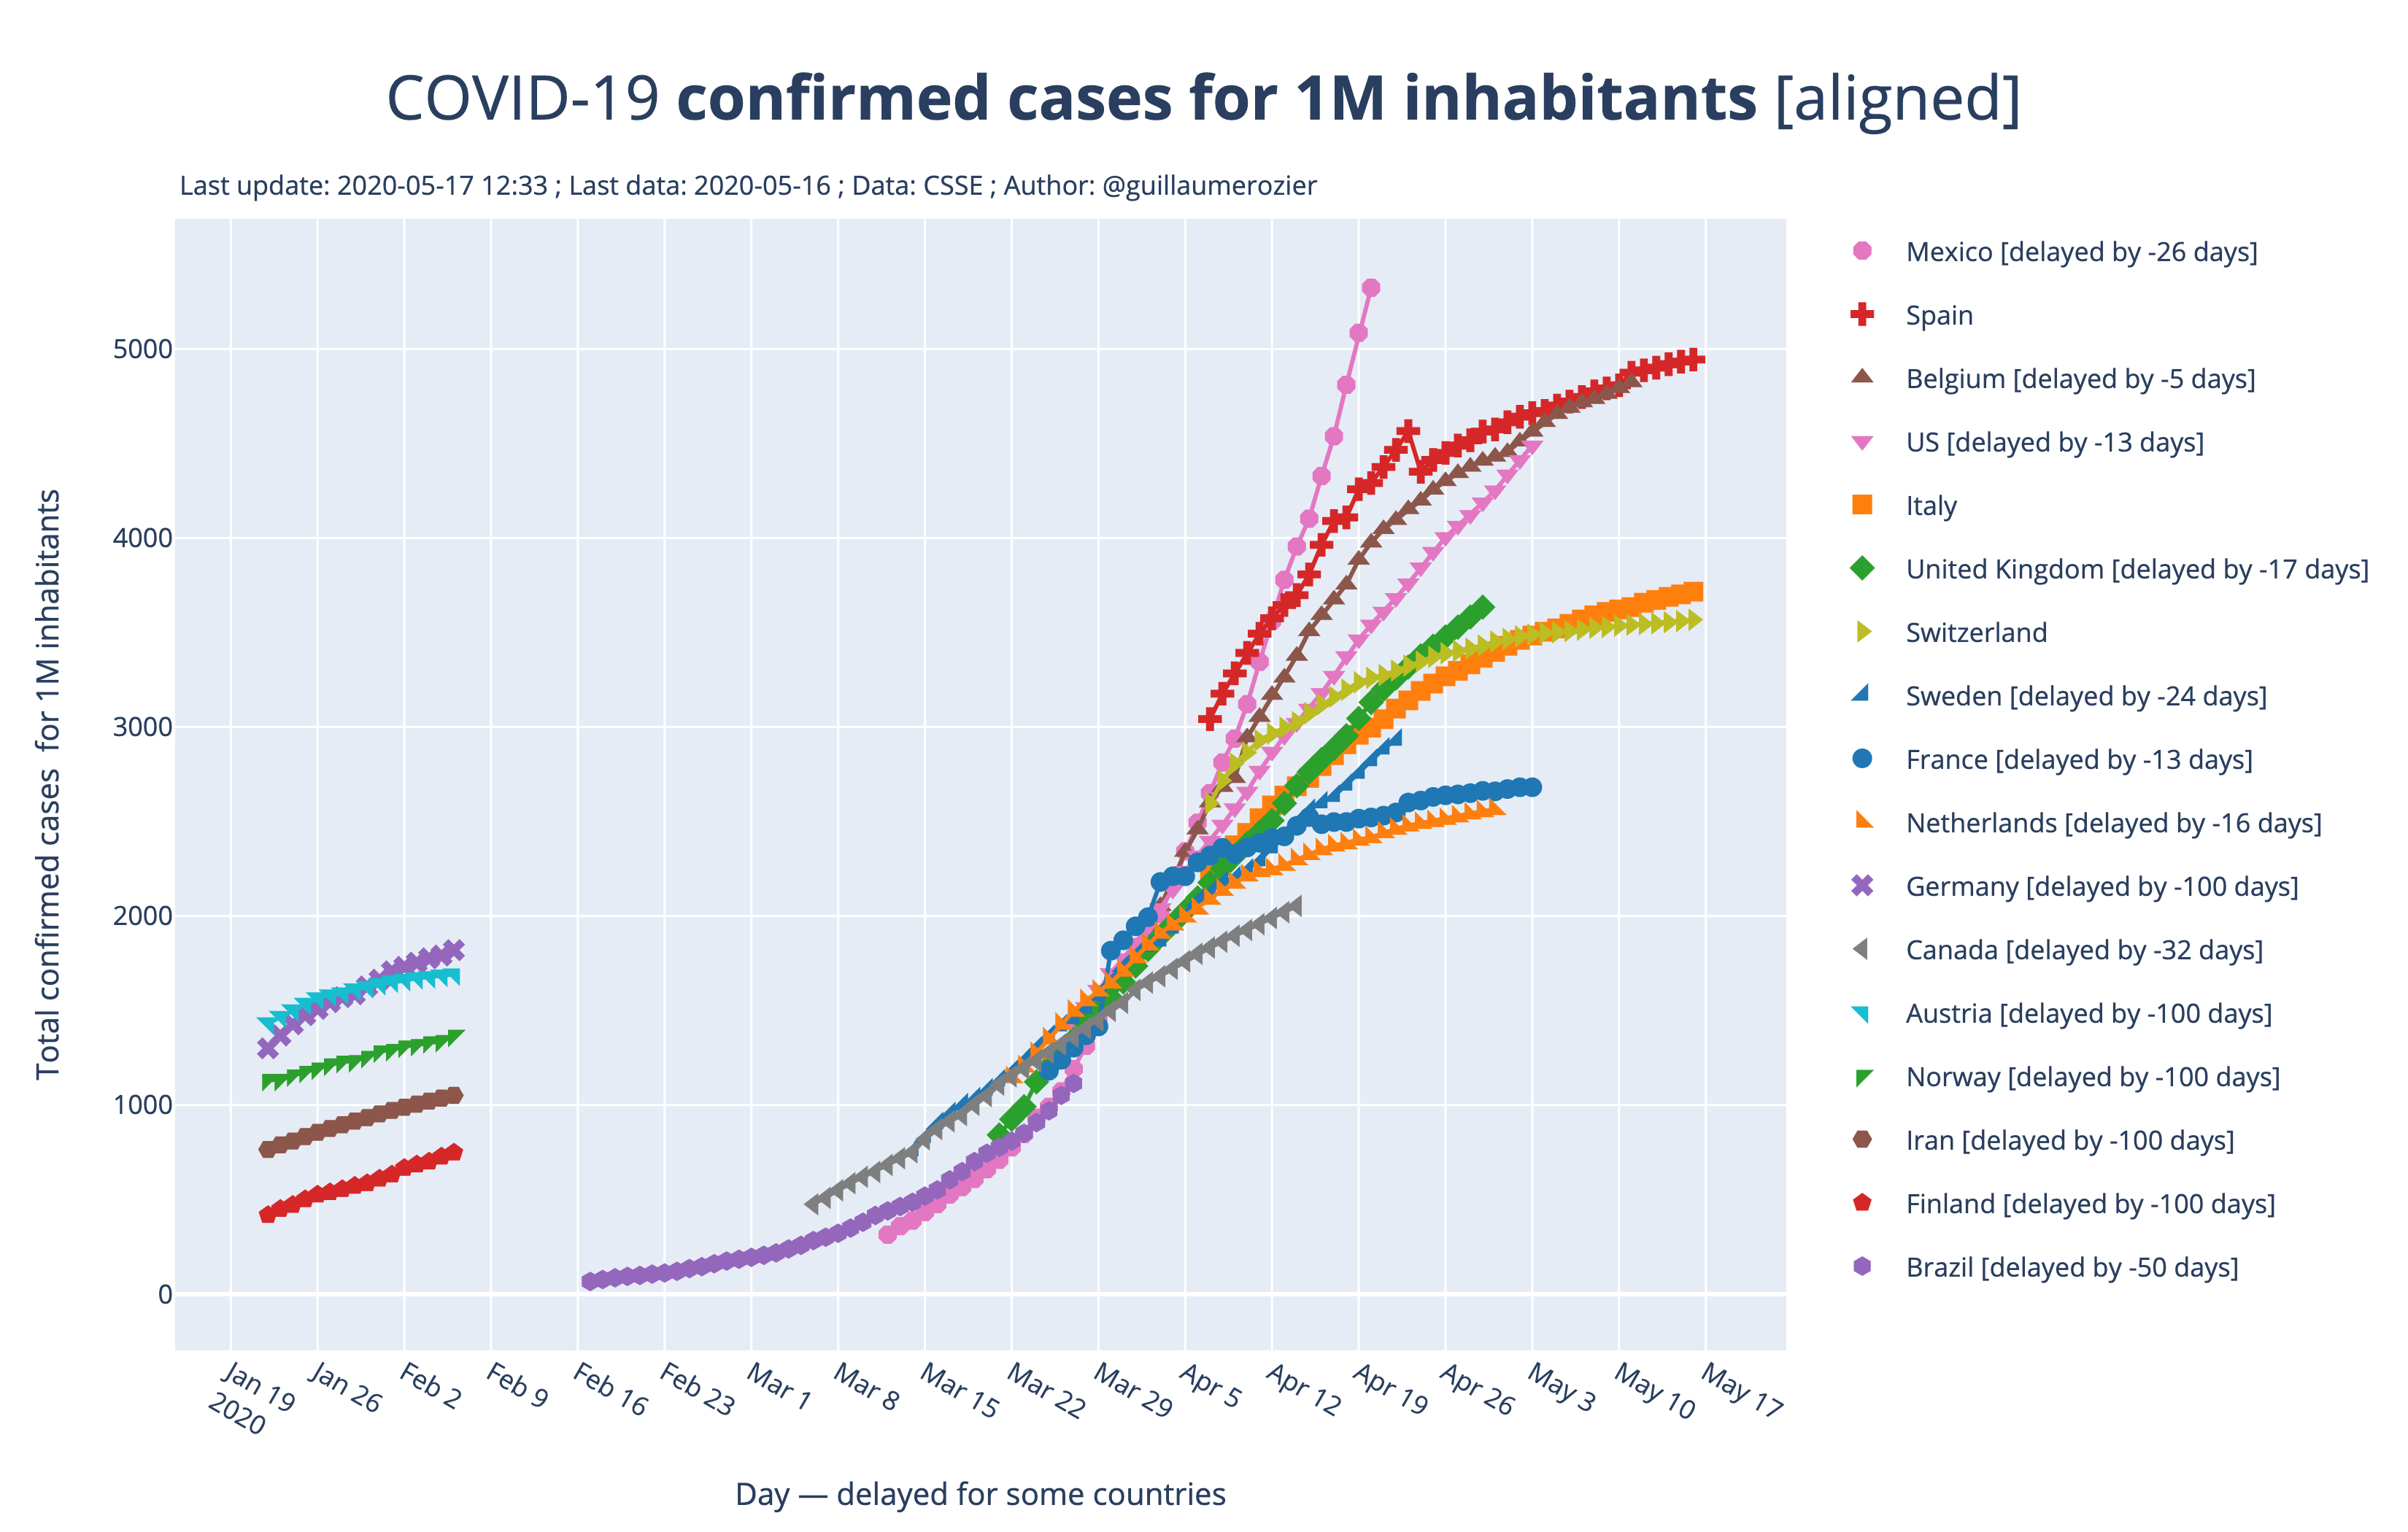
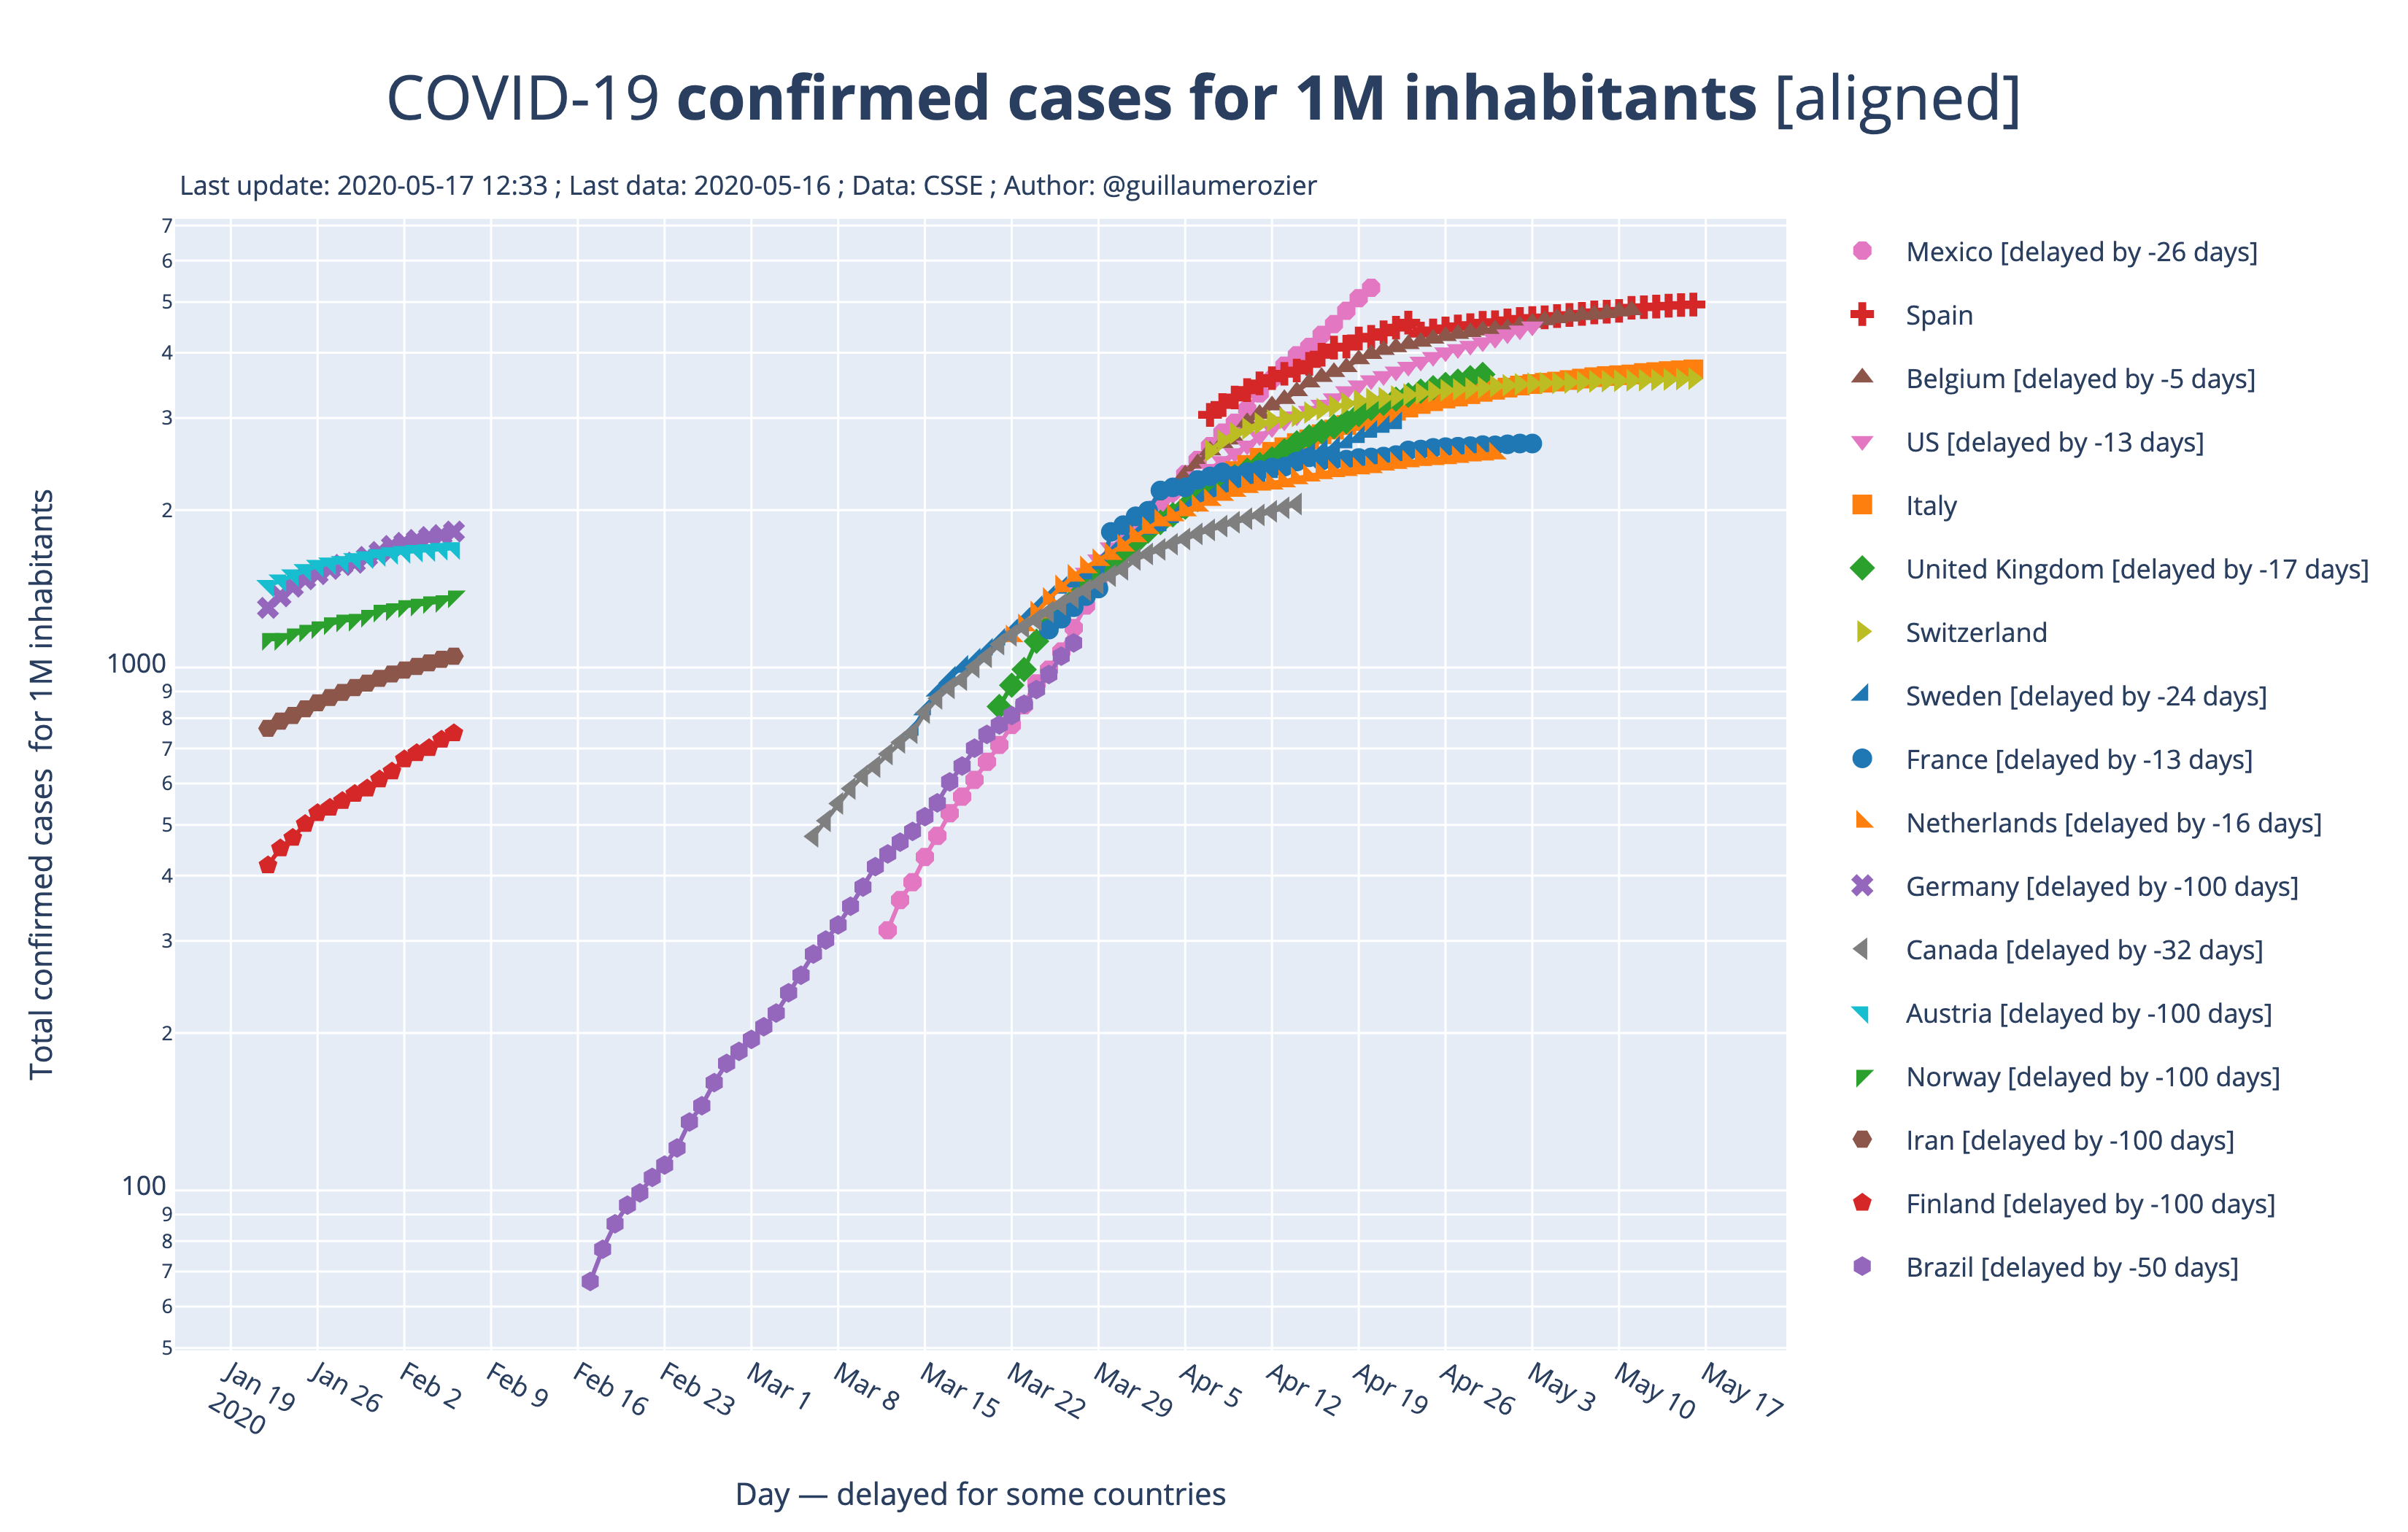
Confirmed cases for 1M inhabitants [aligned]\
:arrow_right: Show Graph • Show Graph (log. scale) • Download Image • Download Image (log. scale)\
Same as the first one, but each curve is aligned on Italy using the Least Squares method. It is easier to compare the progression of each curve.
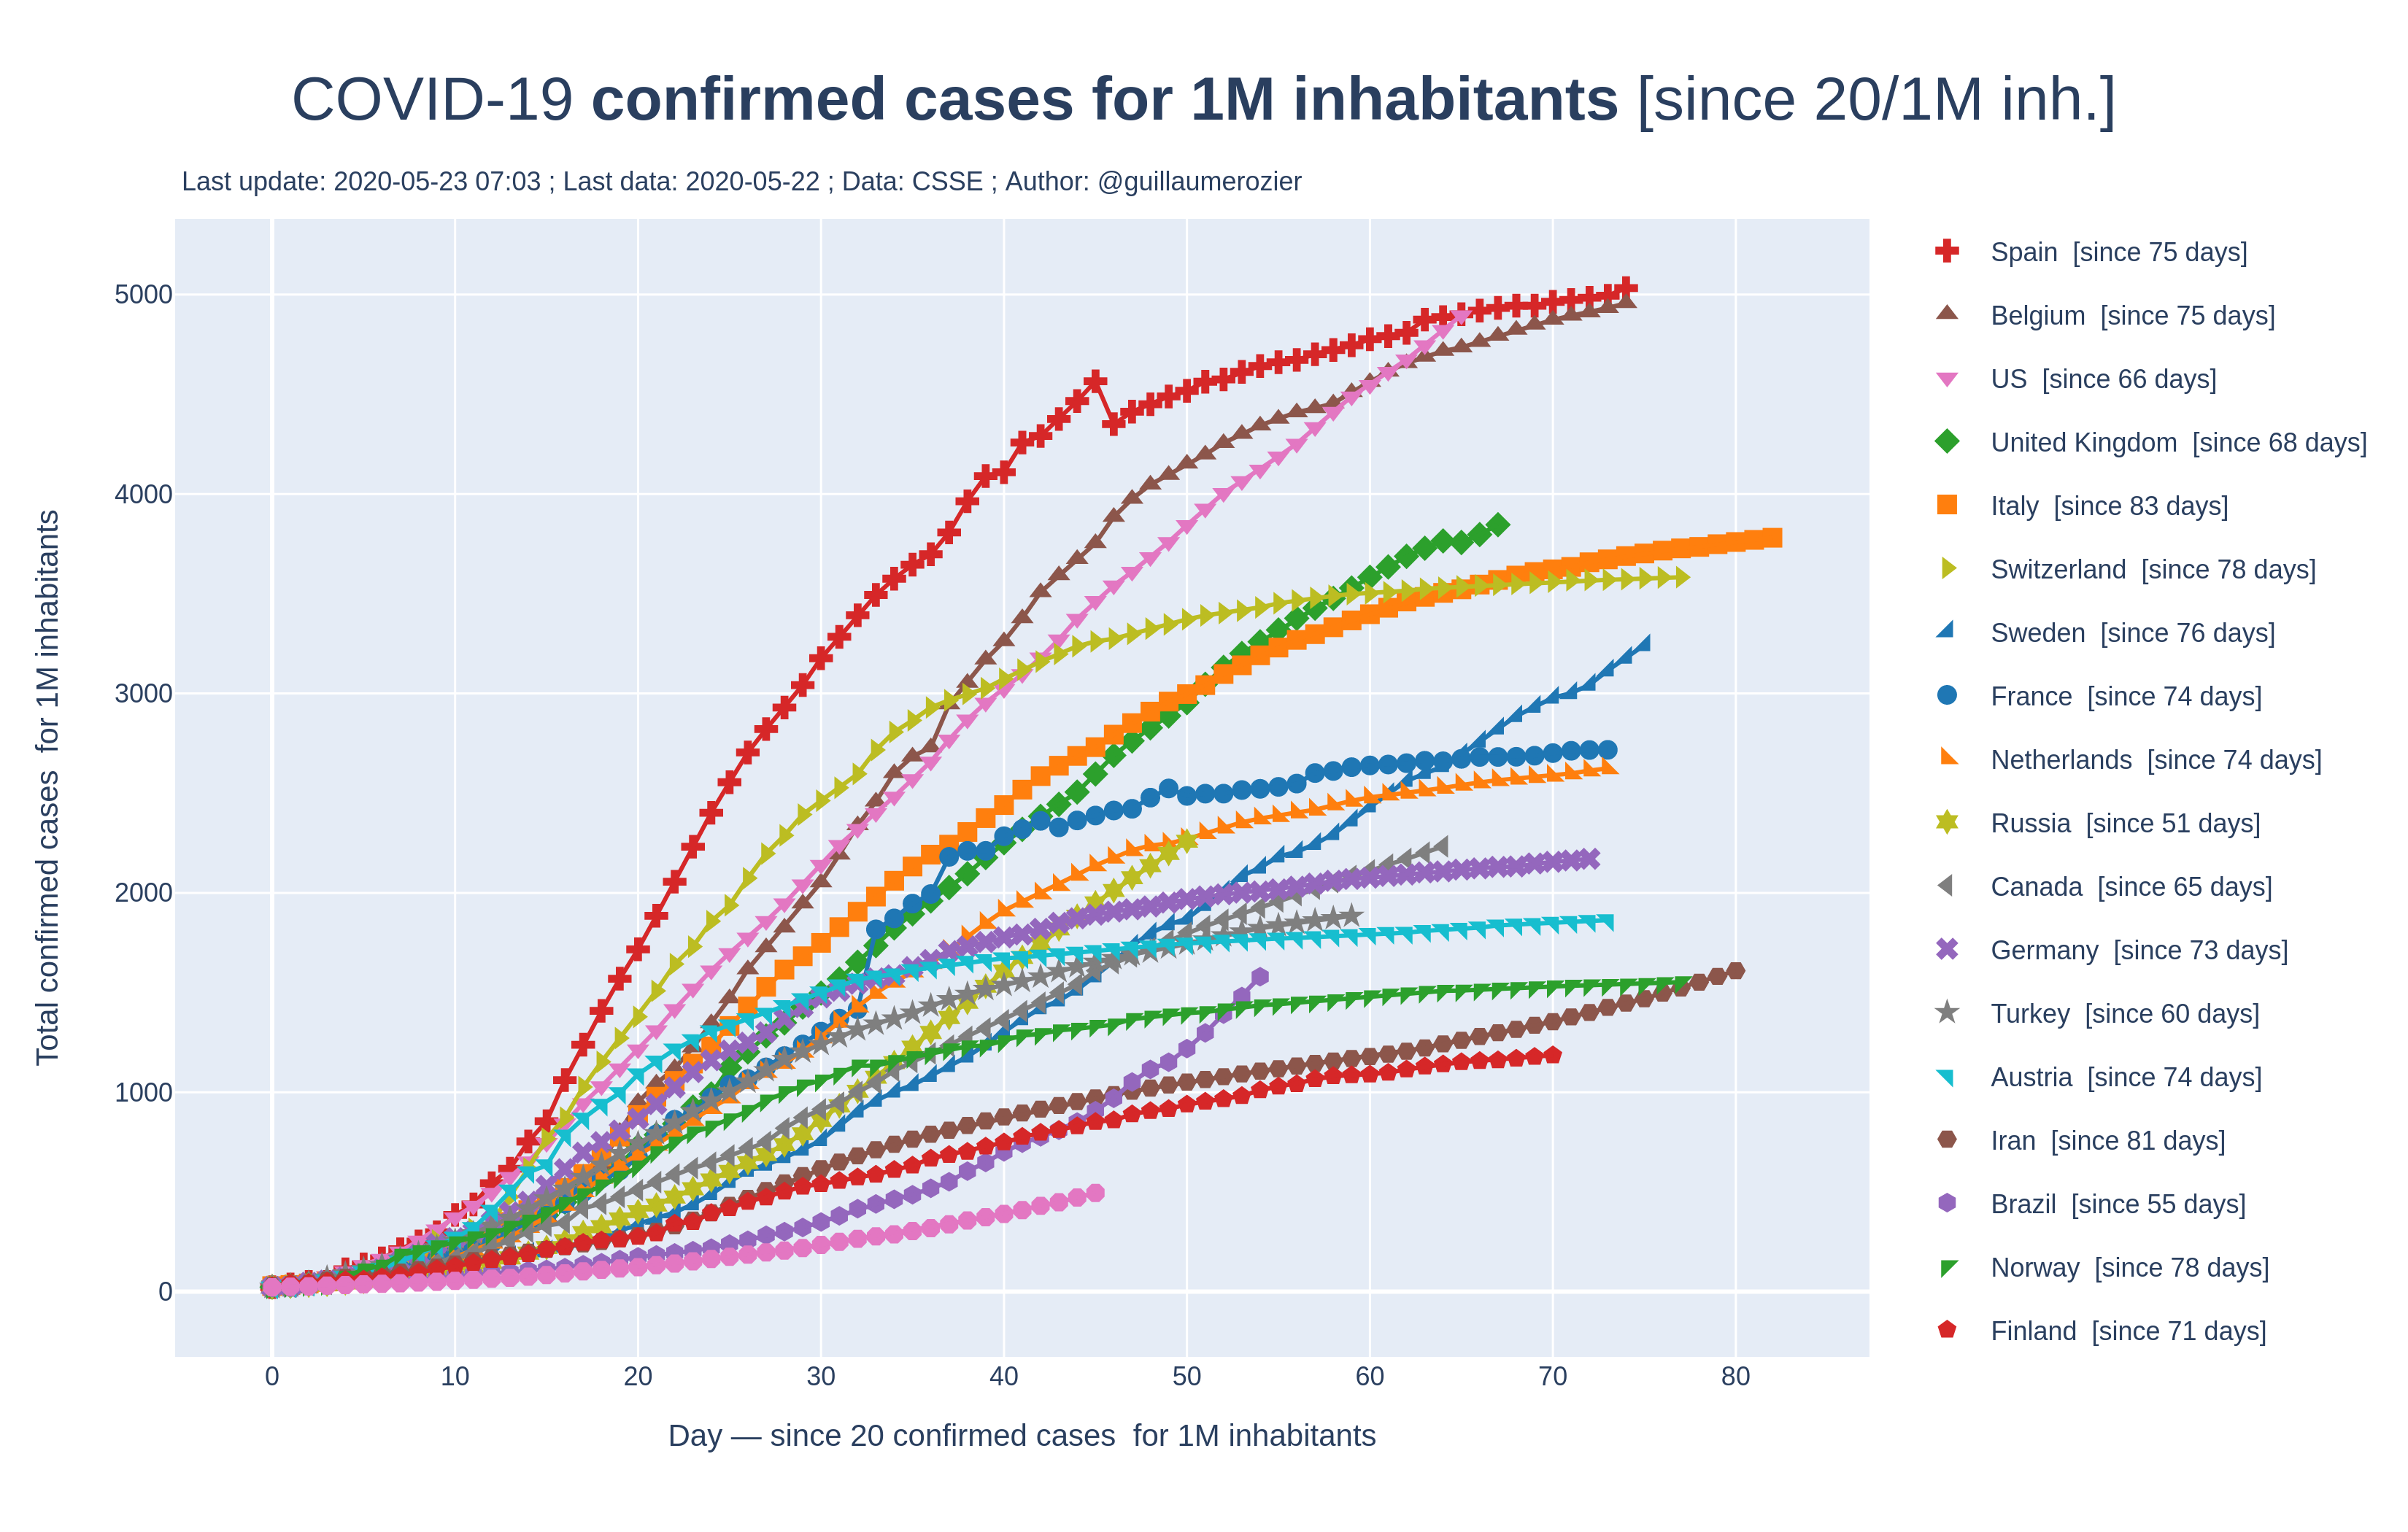
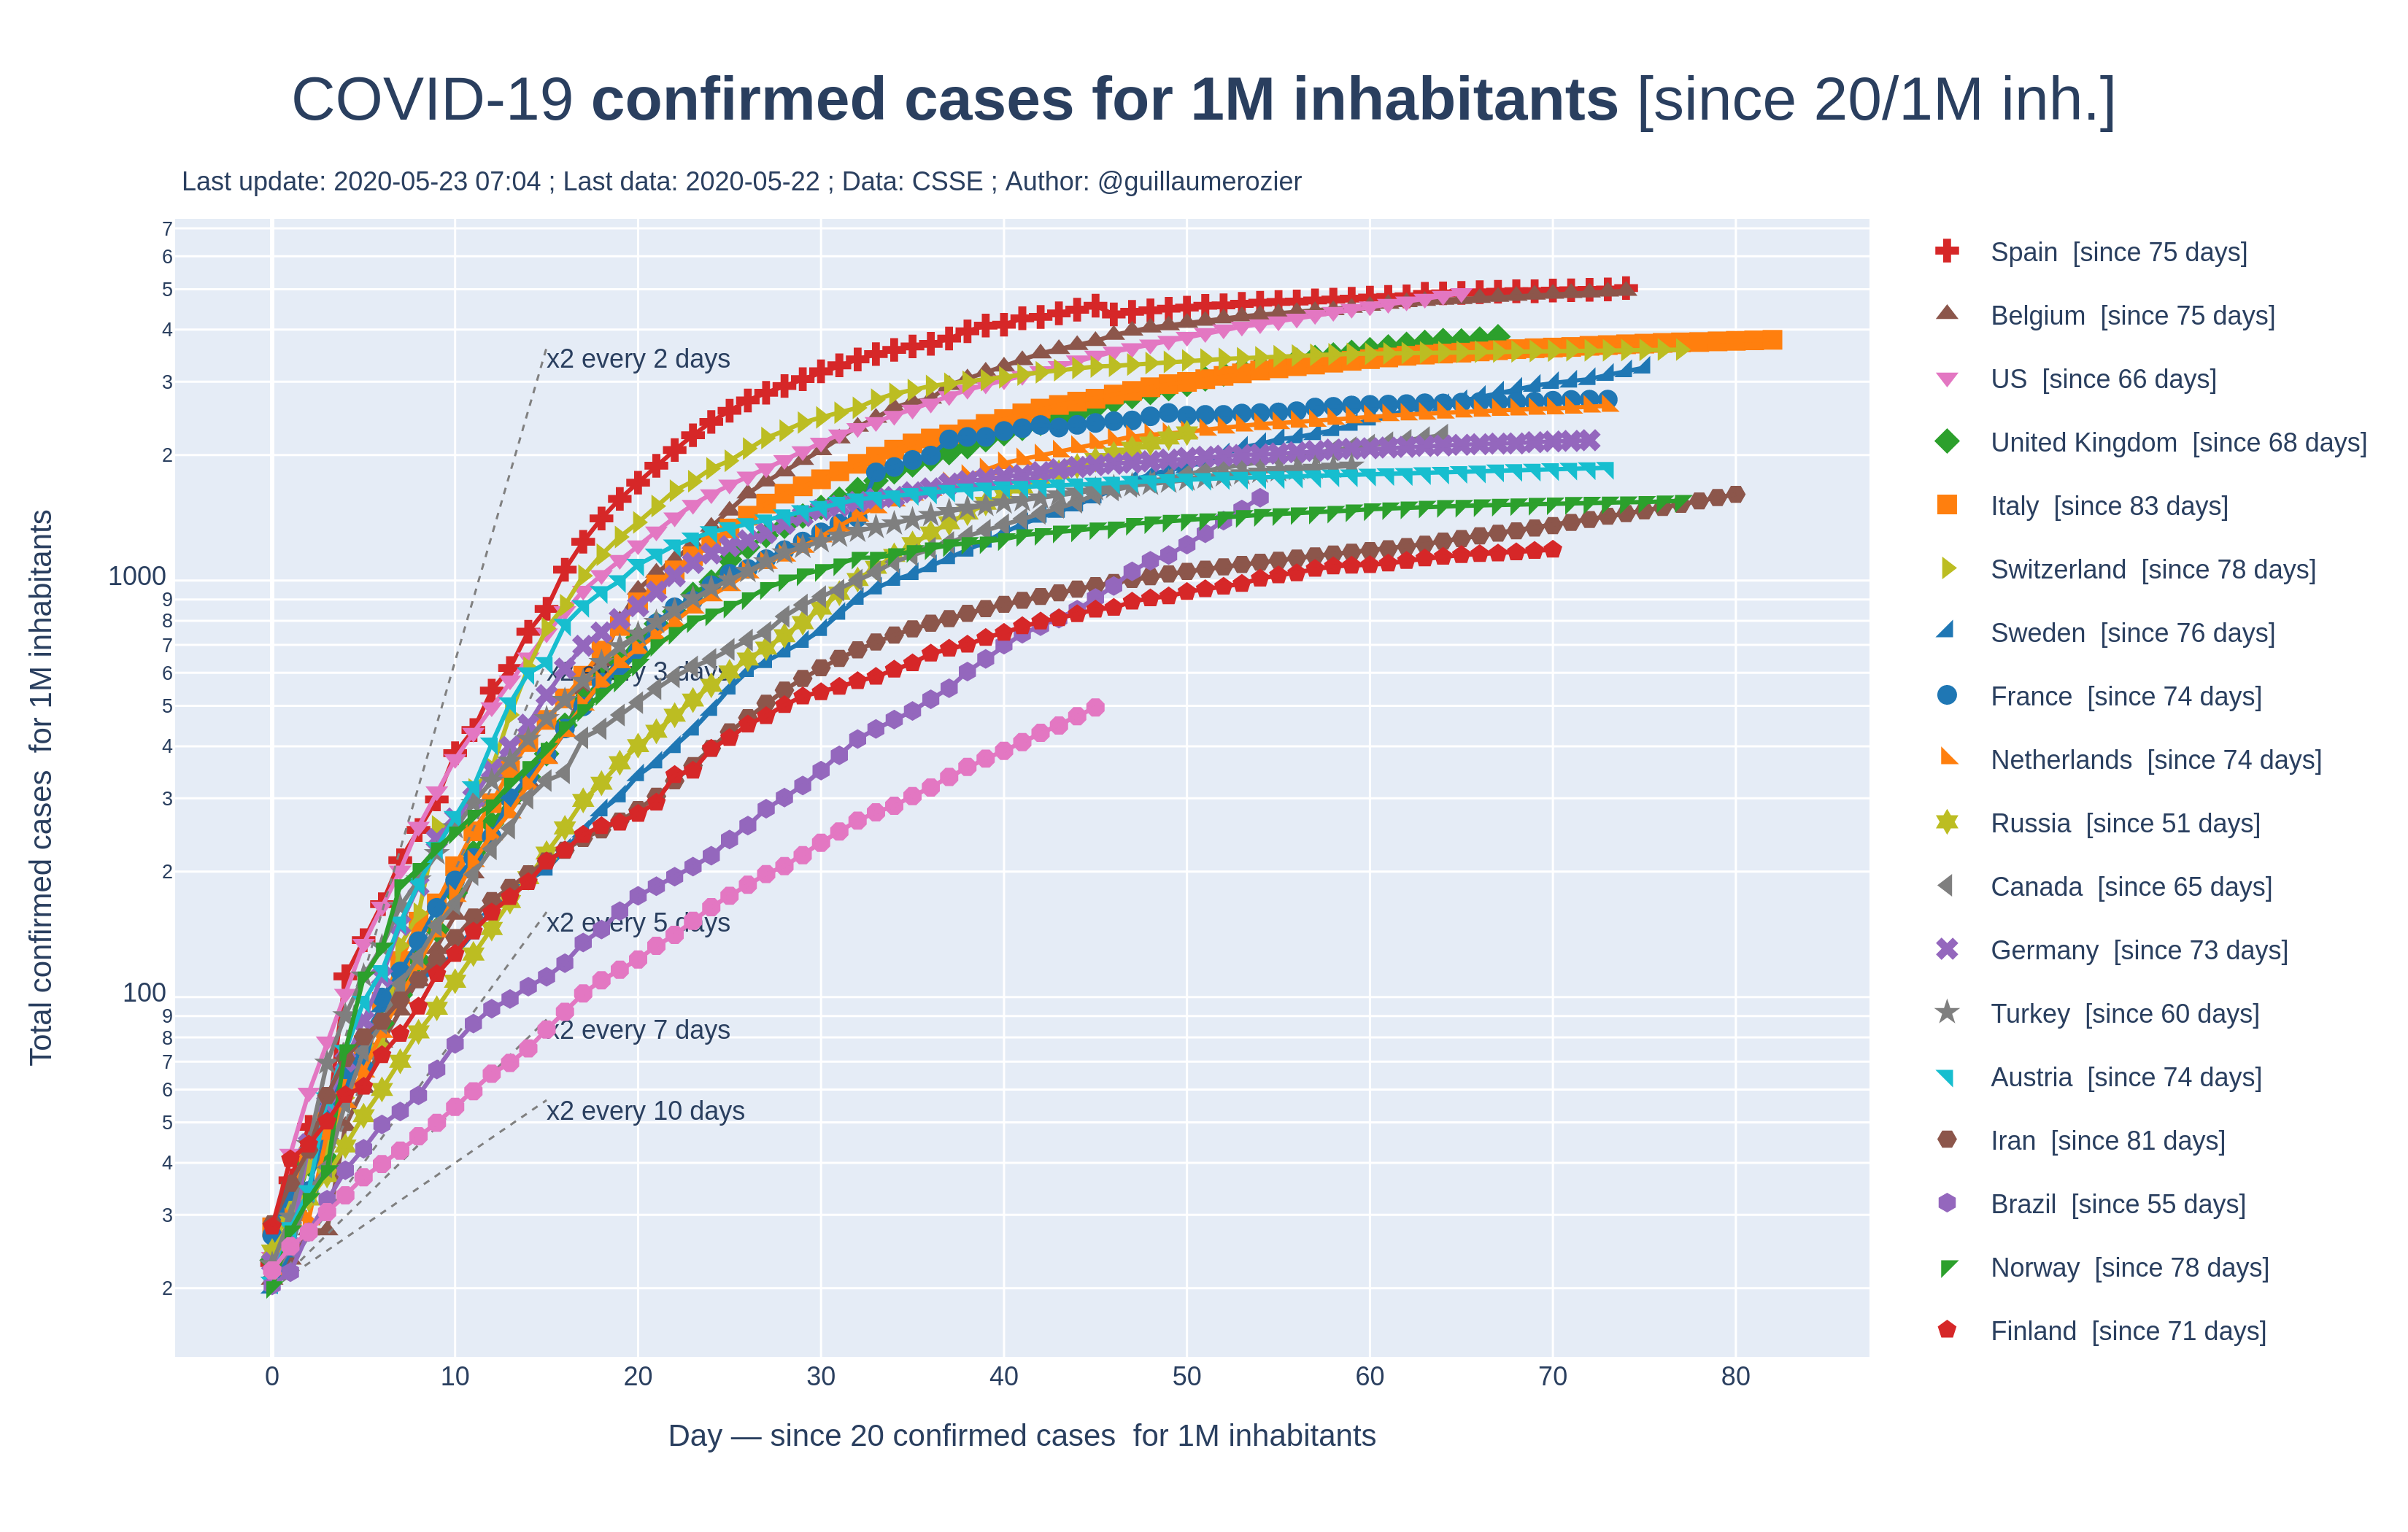
Confirmed cases for 1M inhabitants [since a threshold]\
:arrow_right: Show Graph • Show Graph (log. scale) • Download Image • Download Image (log.)\
Same as the second one, but each country is displayed from the day a certain threshold has been reached. This makes it possible to compare the recent increase in the number of cases between countries.
Deaths caused by COVID-19

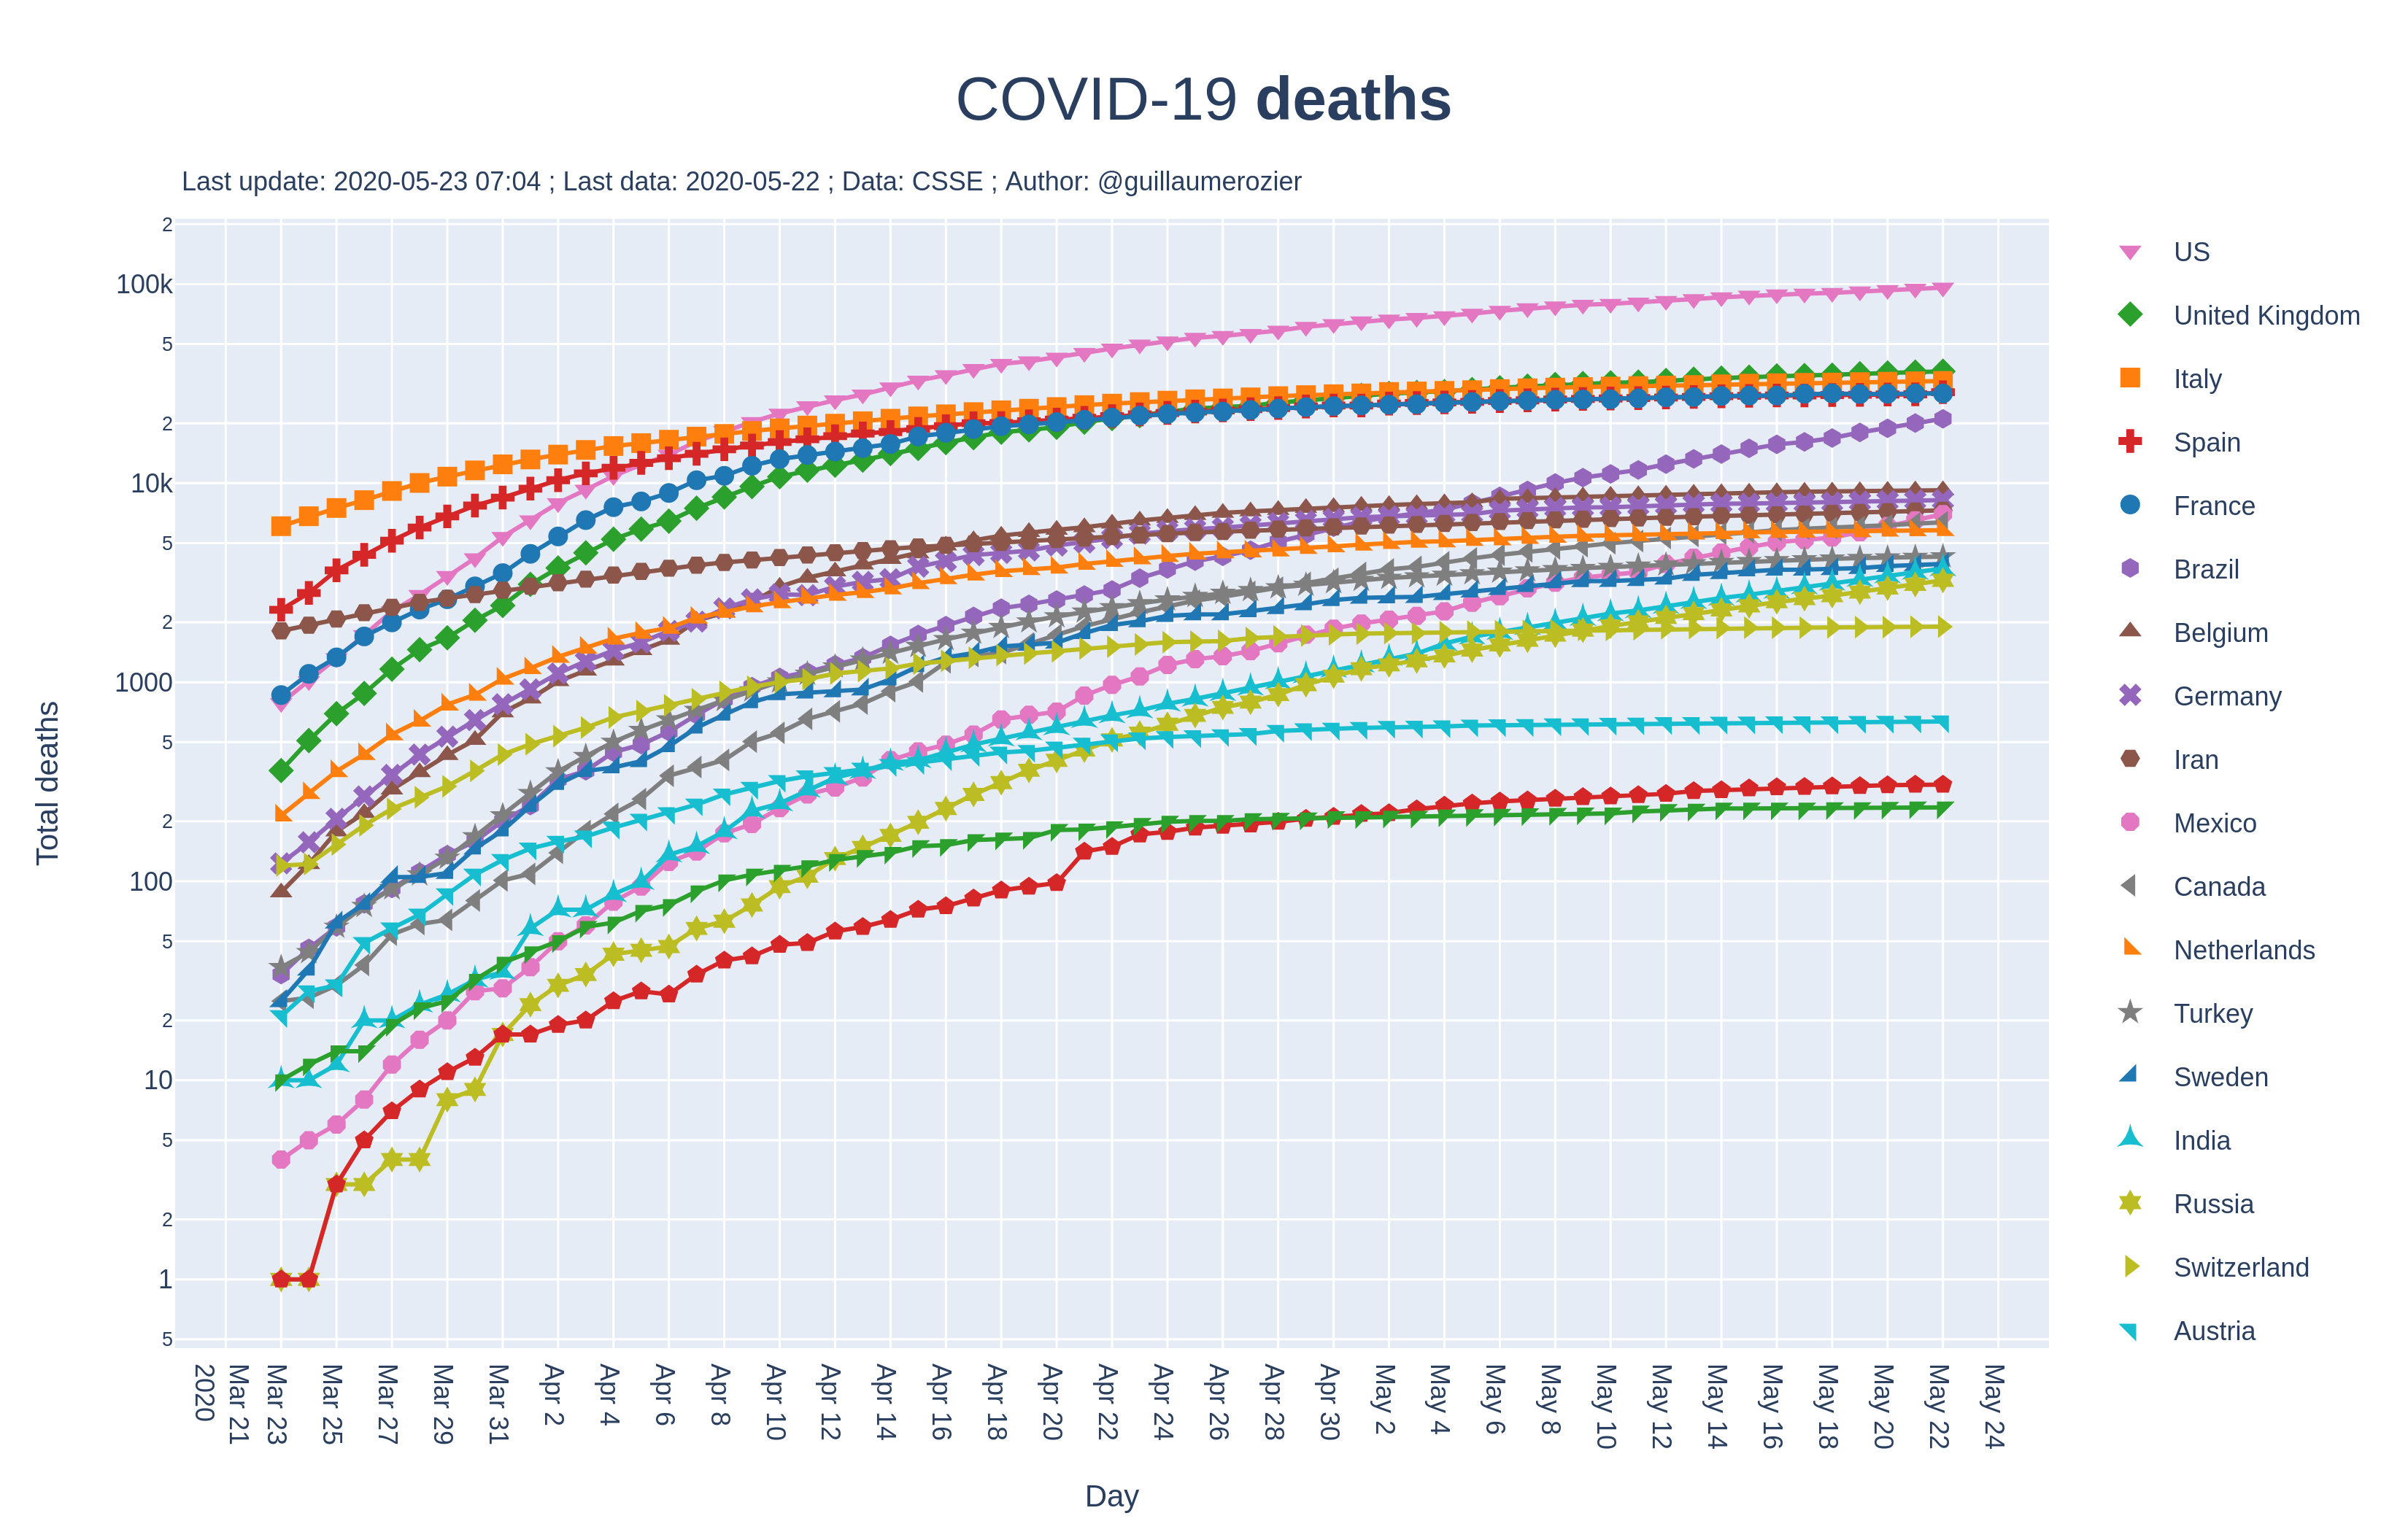
Deaths\
:arrow_right: Show Graph • Show Graph (log. scale) • Download Image • Download Image (log. scale)\
This chart represents the total number of deaths of COVID-19 against time, in days.
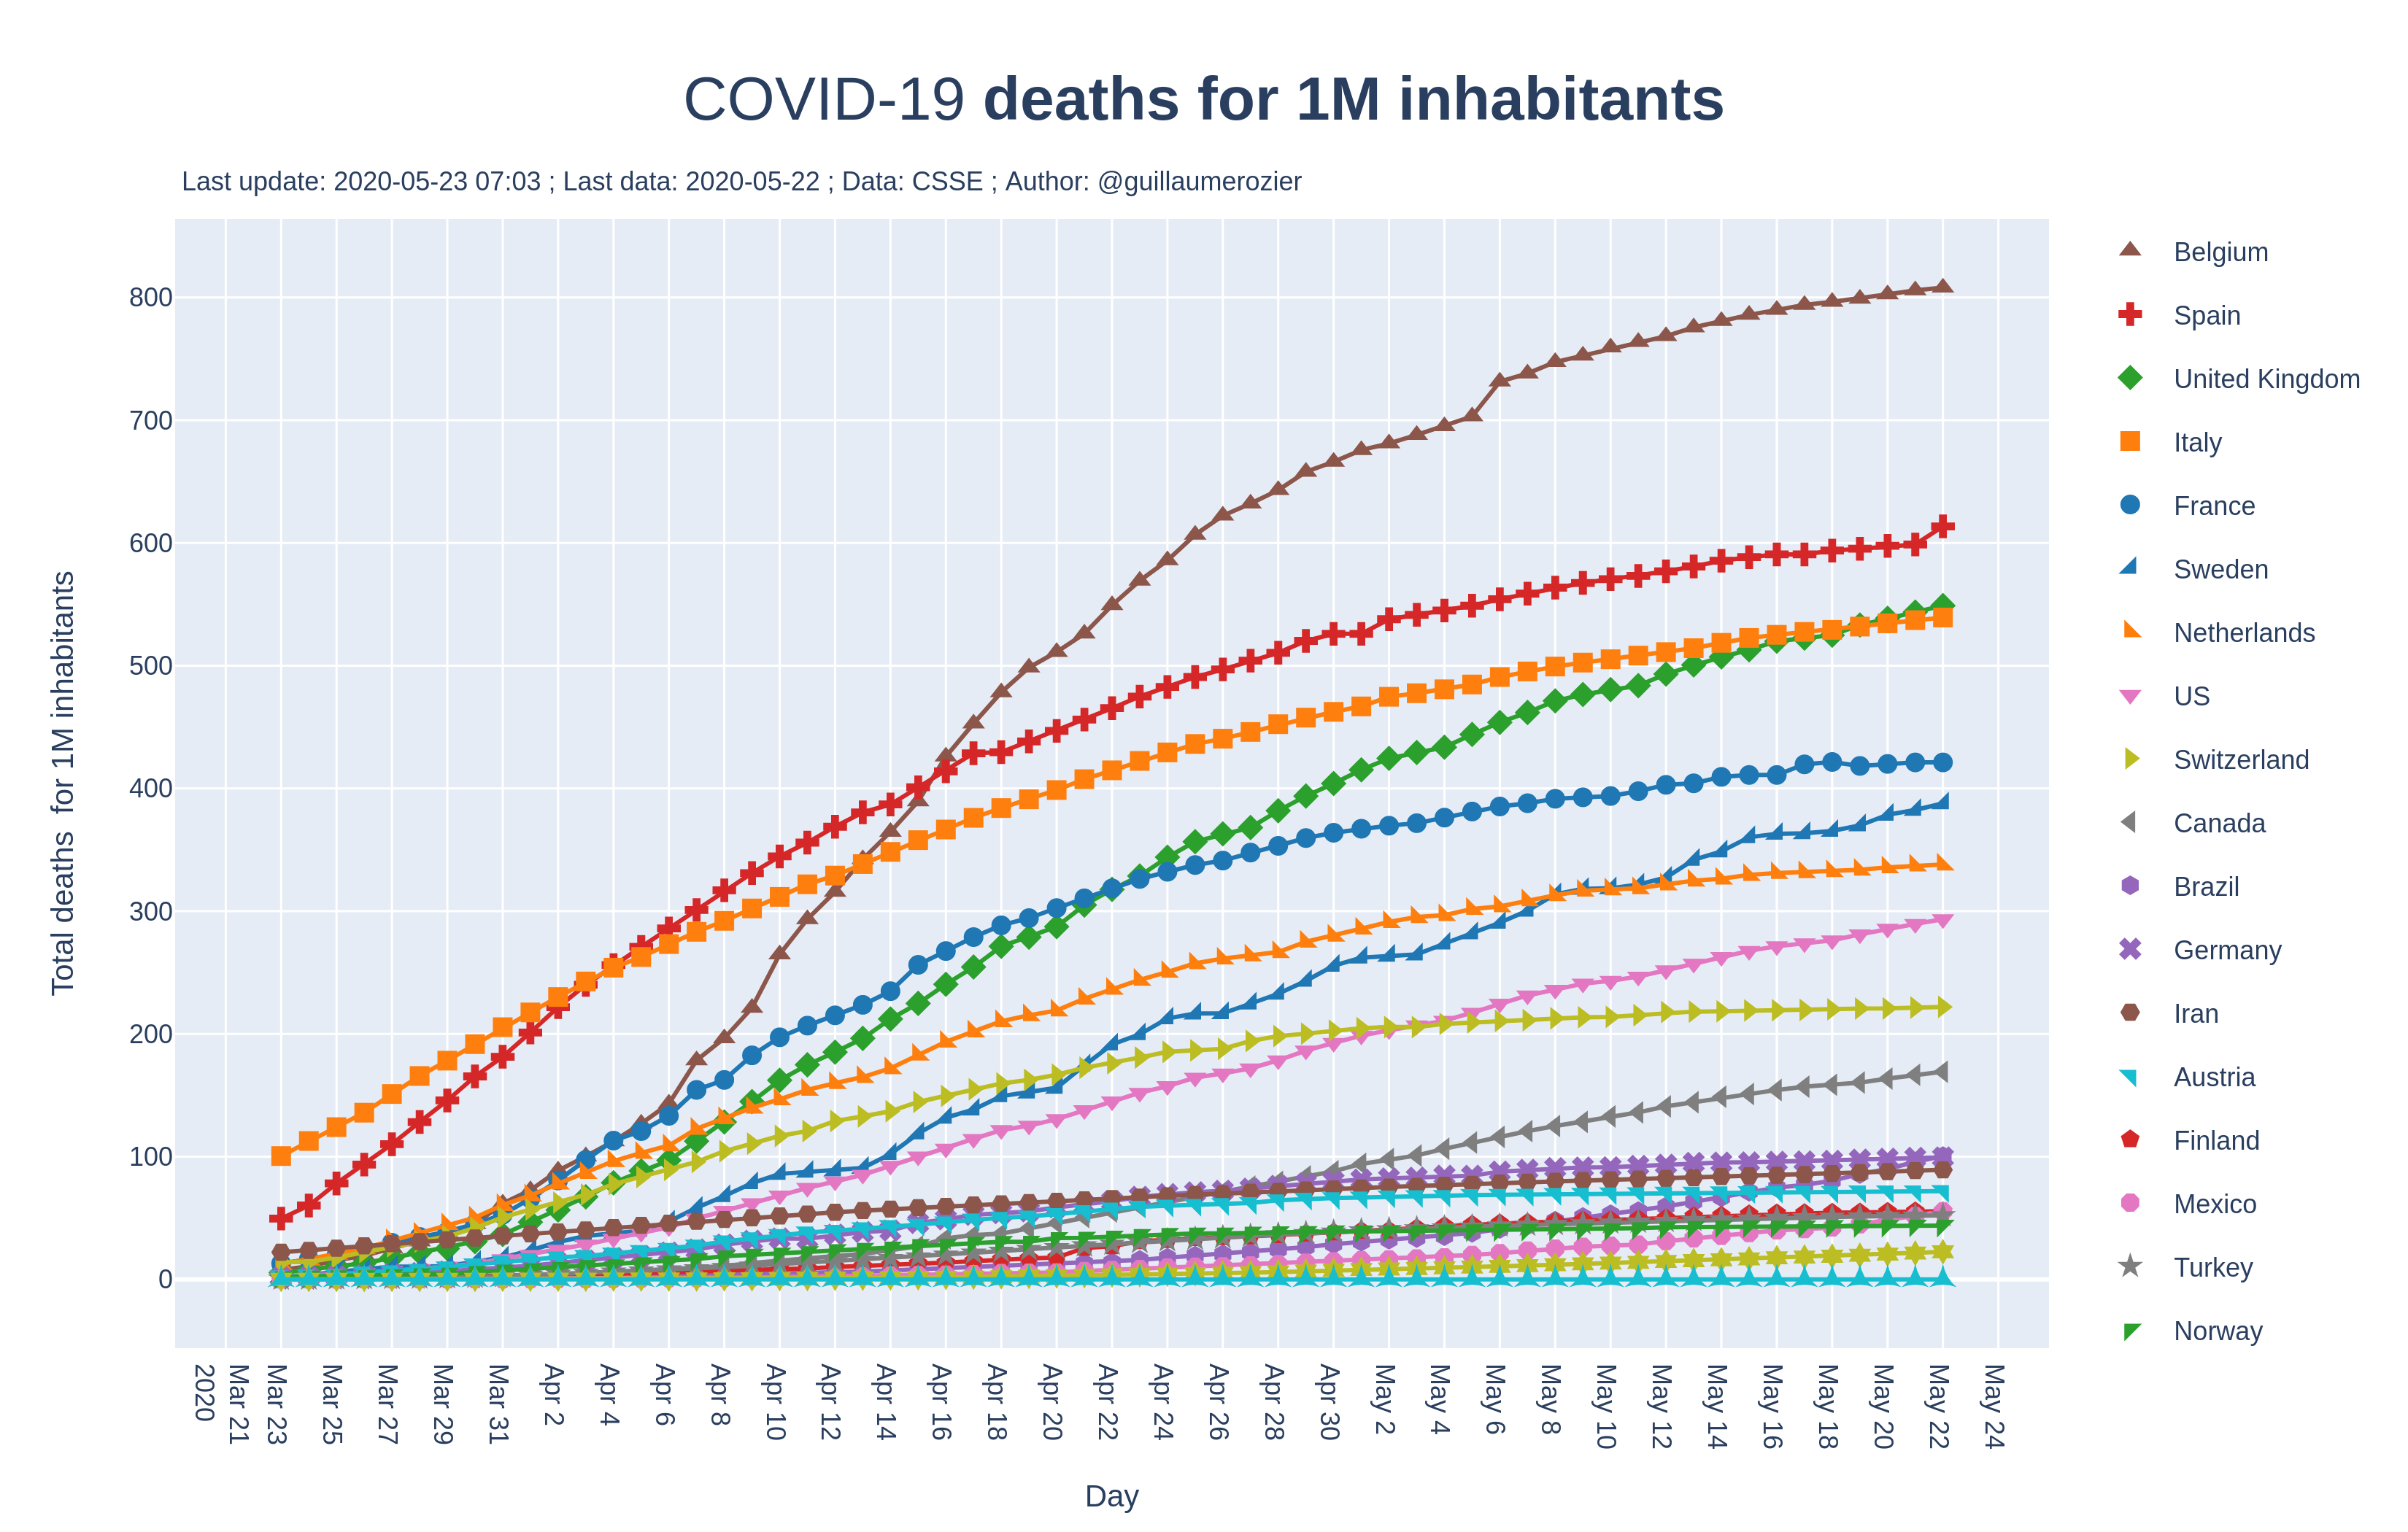
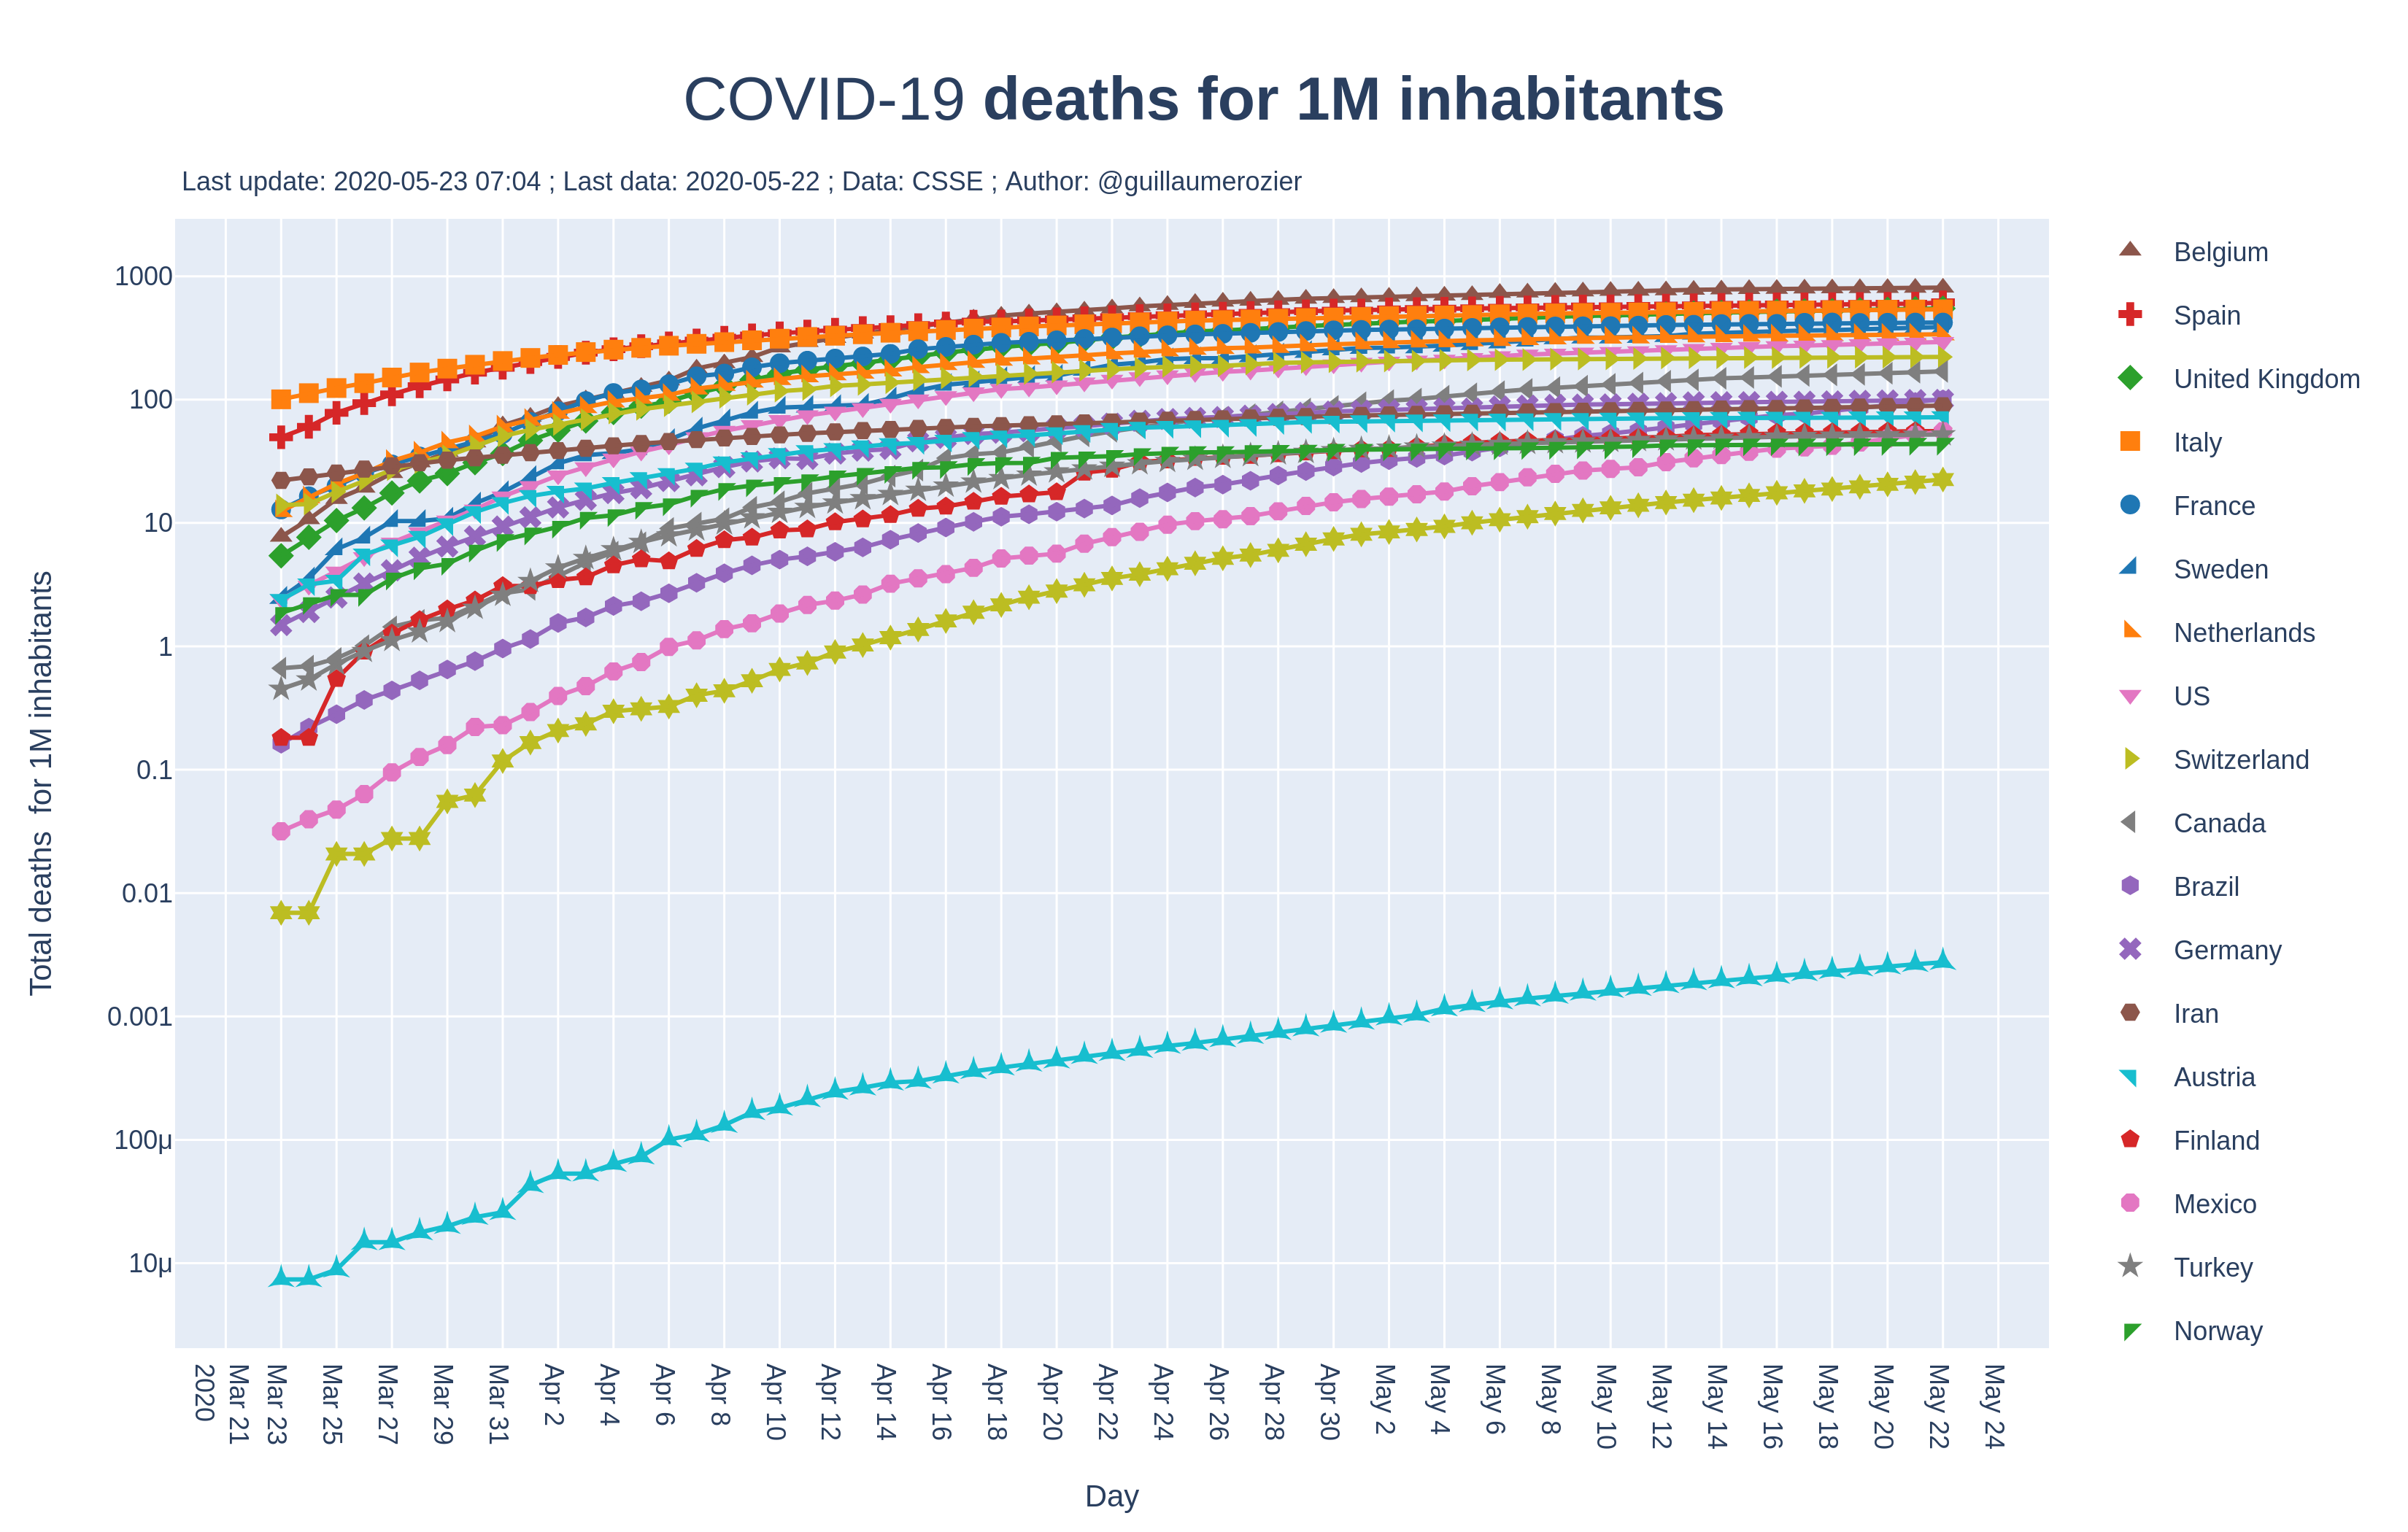
Deaths for 1M inhabitants\
:arrow_right: Show Graph • Show Graph (log. scale) •Download Image • Download Image (log. scale)\
Same as the first one, but the number of cases is divided by the population of each country. So the plotted data is the number of confirmed cases for 1 million inhabitants.
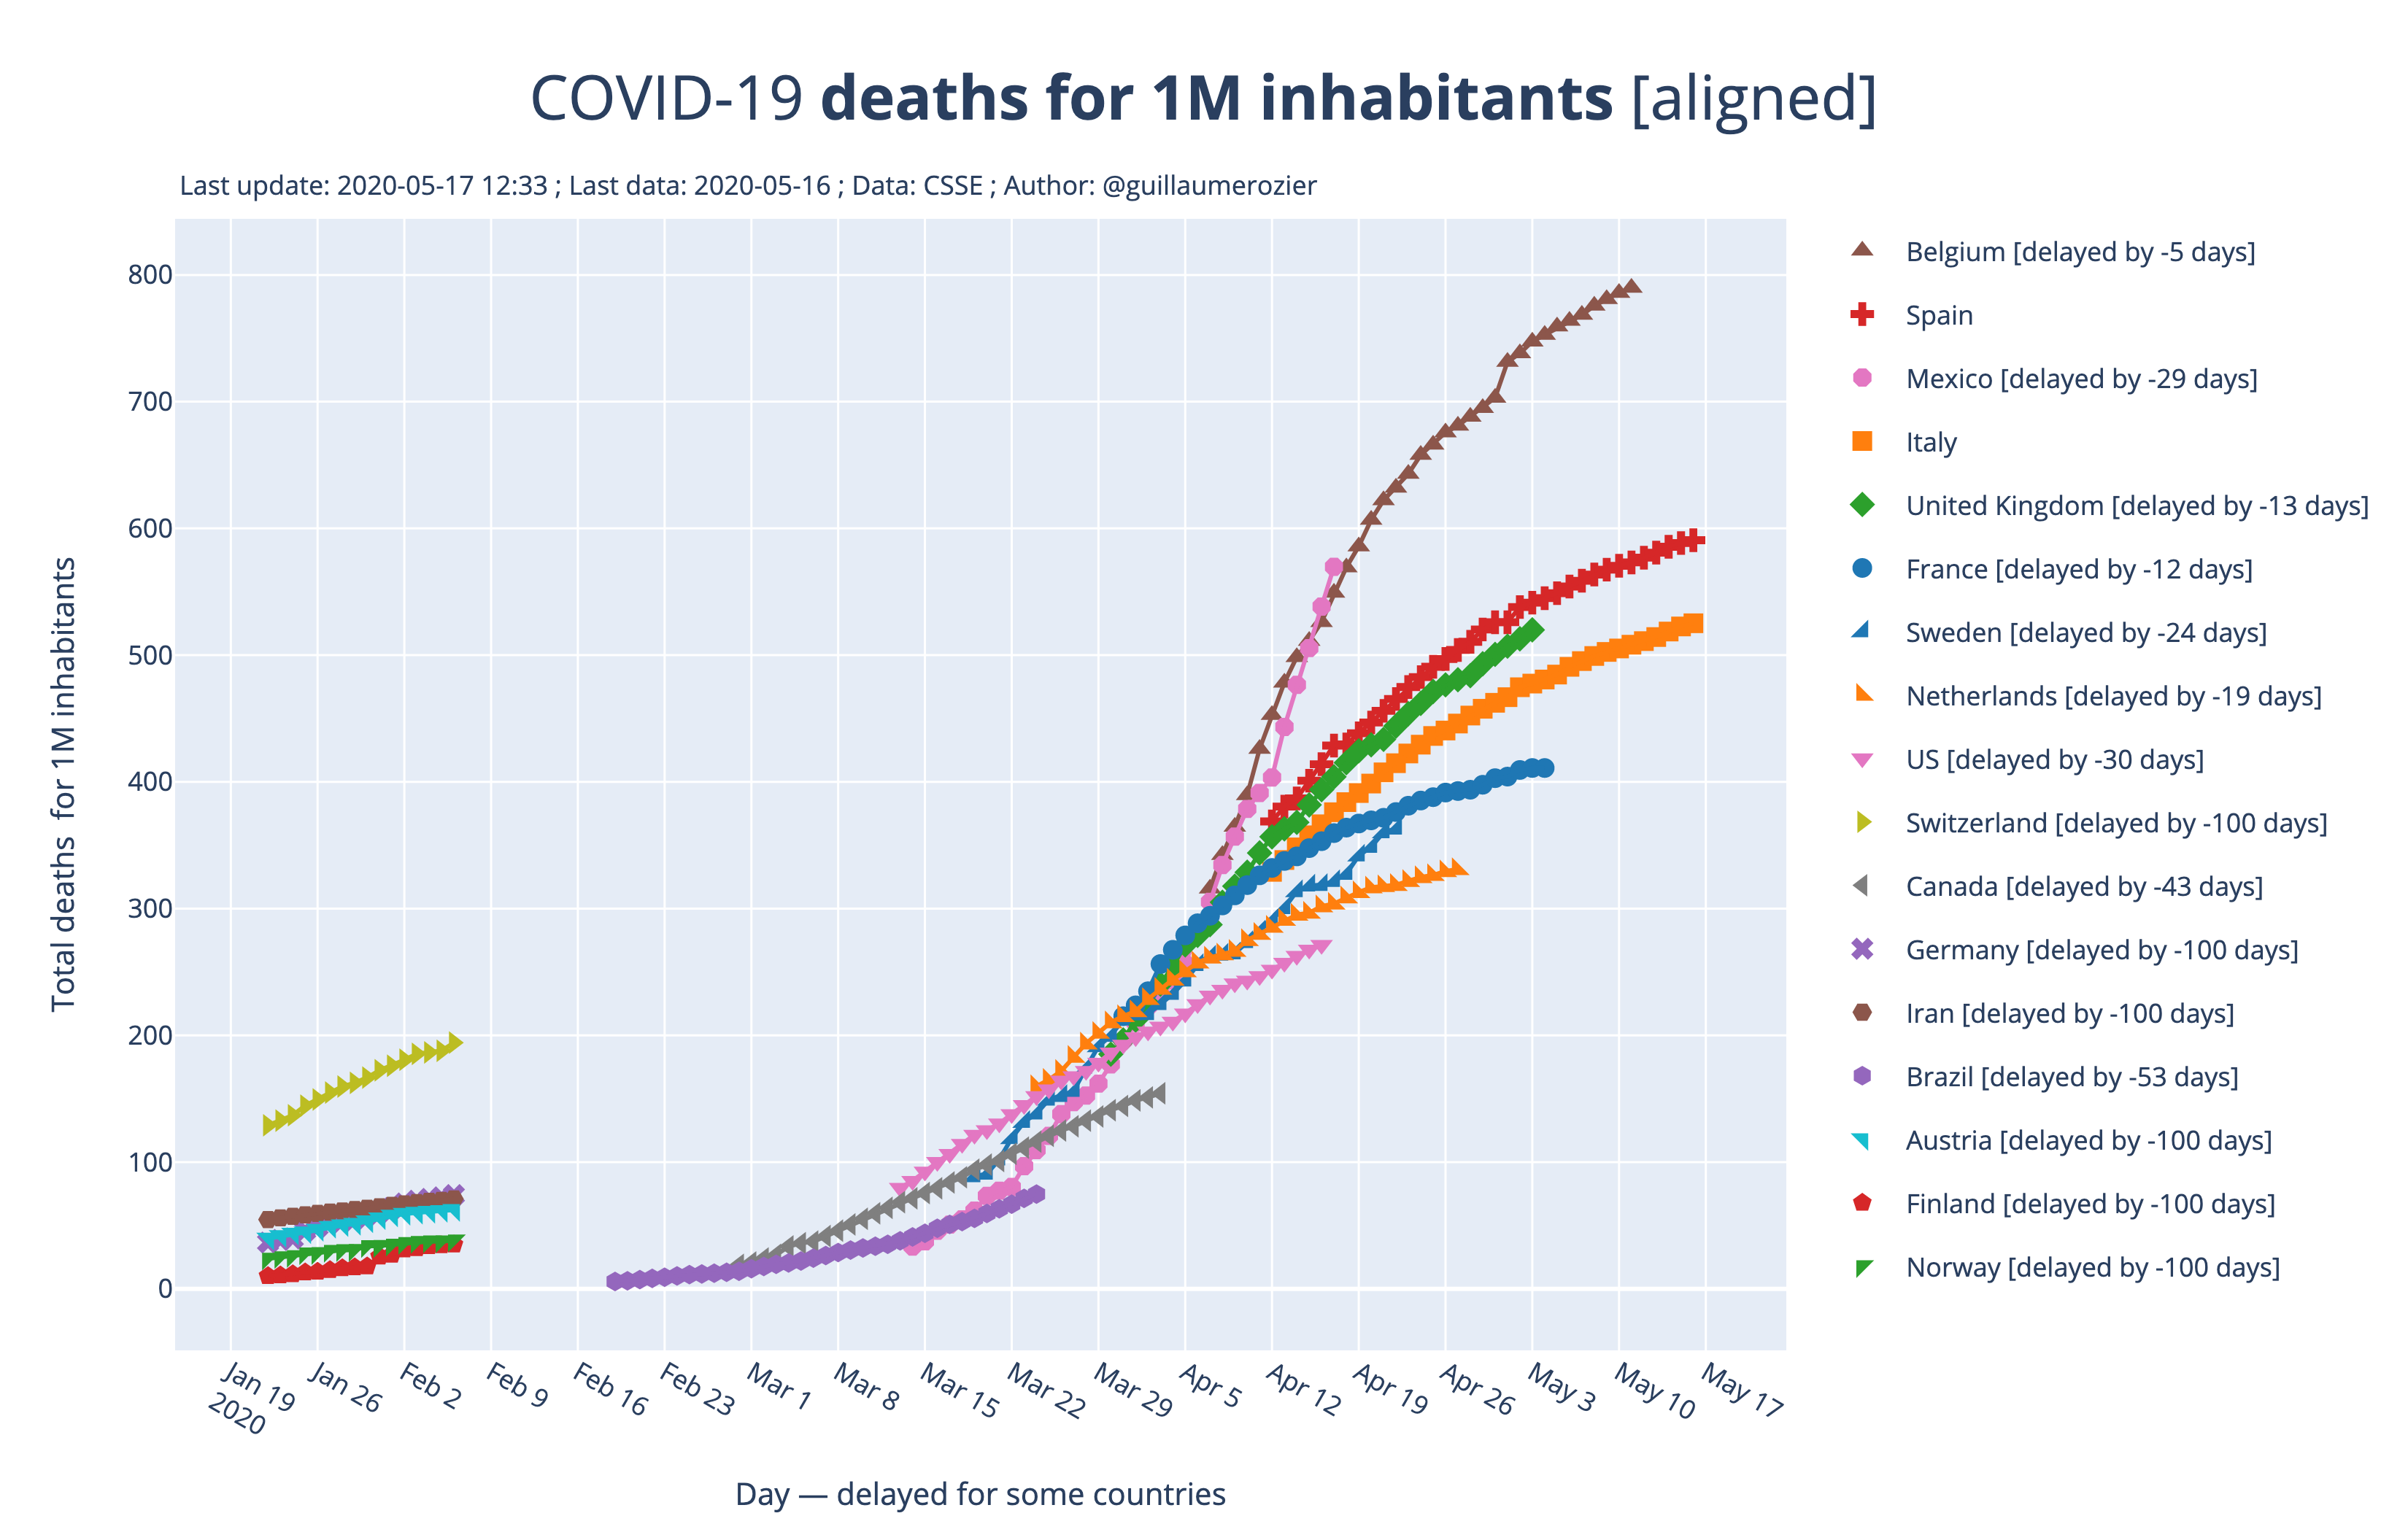
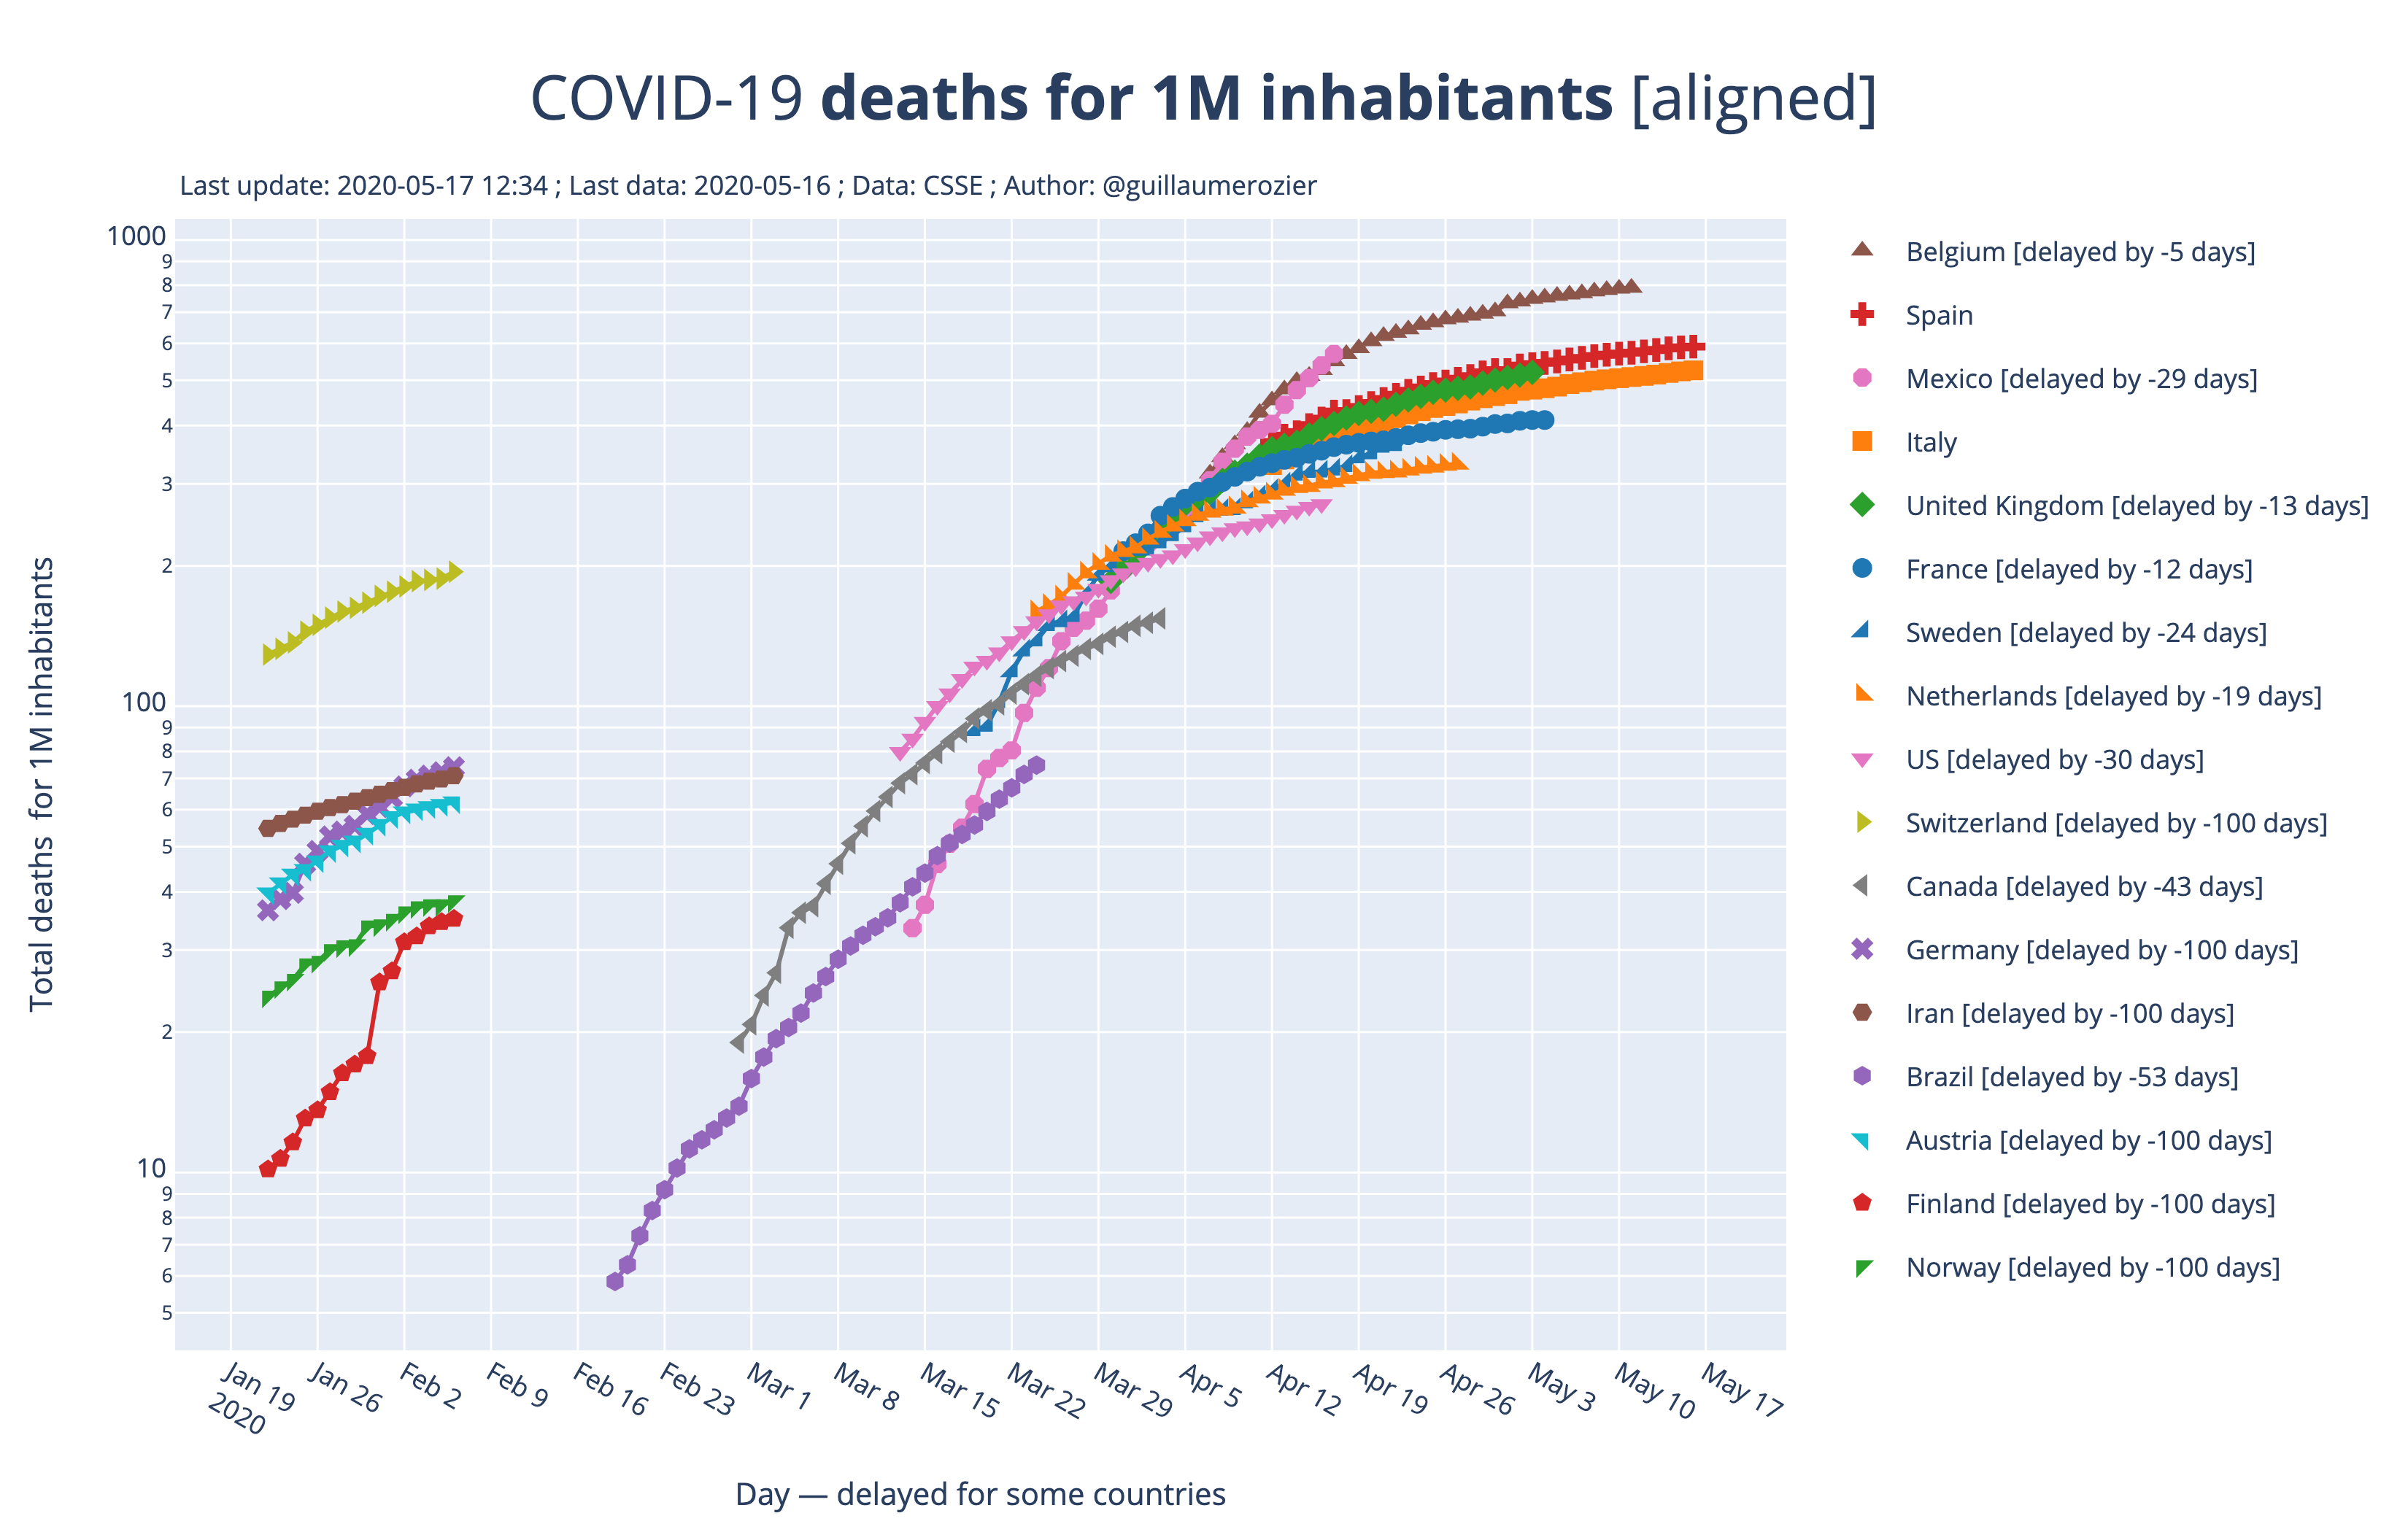
Deaths for 1M inhabitants [aligned]\
:arrow_right: Show Graph • Show Graph (log. scale) • Download Image • Download Image (log. scale)\
Same as the second one, but each curve is aligned on Italy using the Least Squares method. It is easier to compare the progression of each curve.
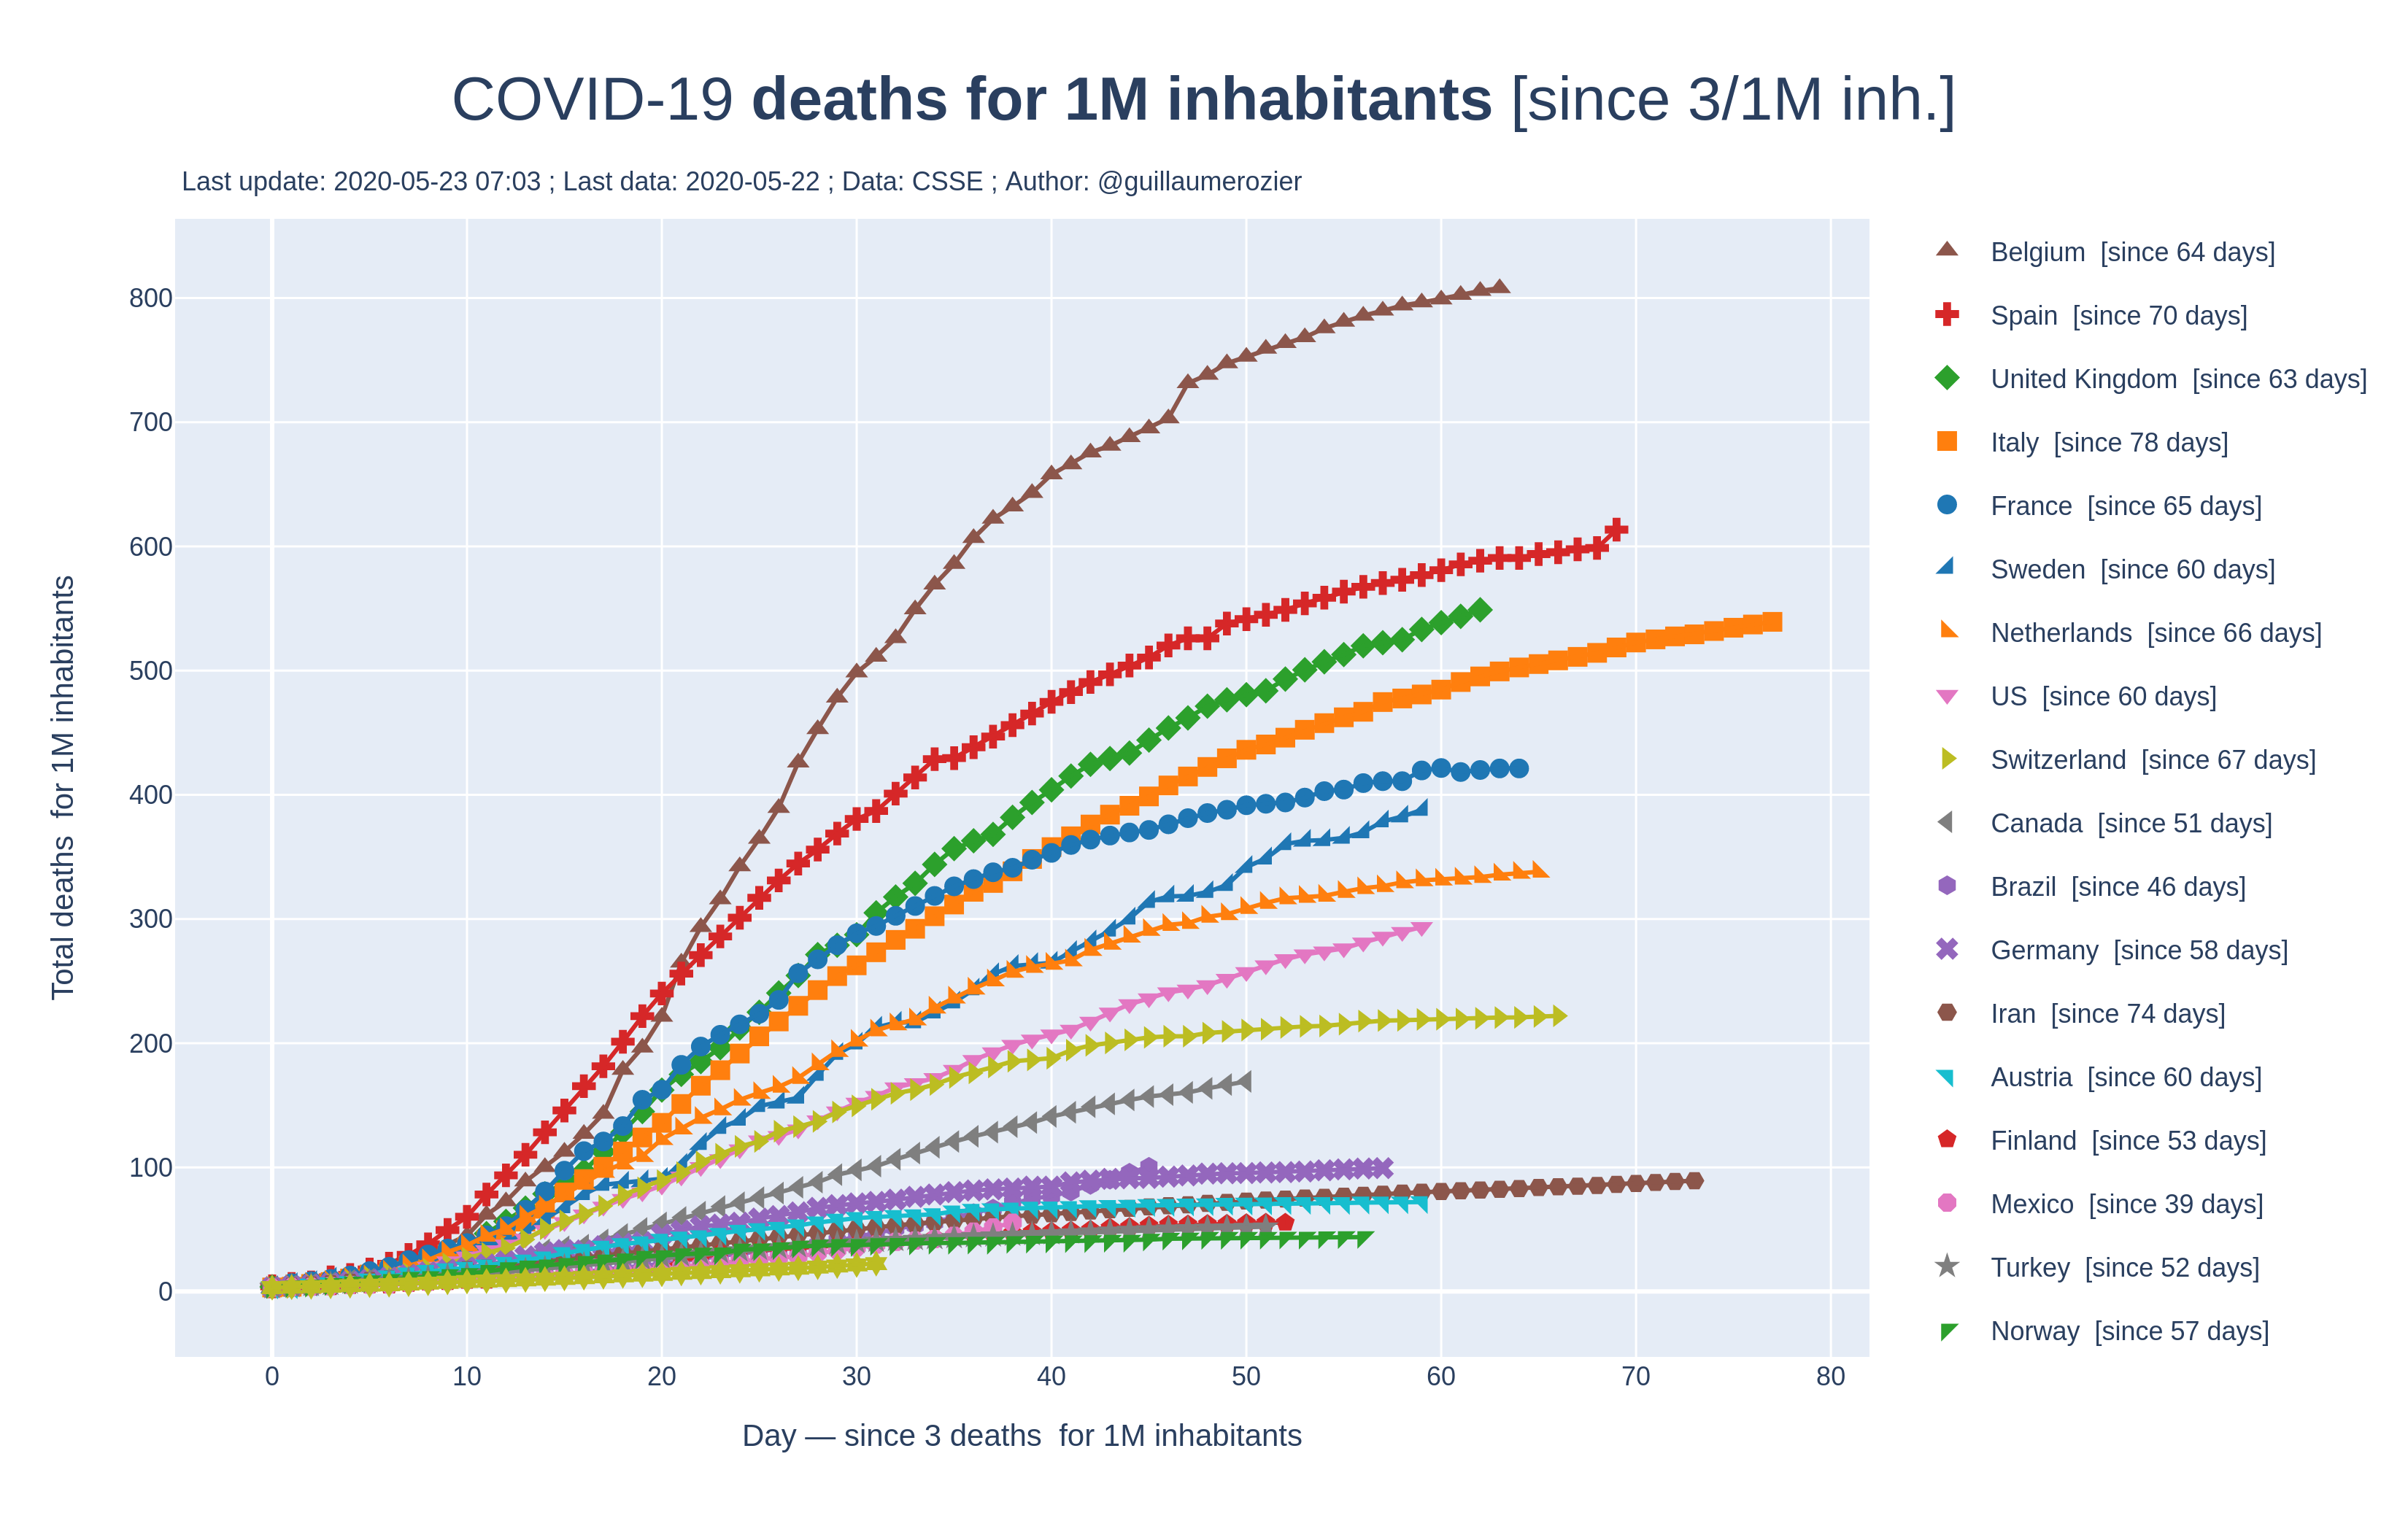
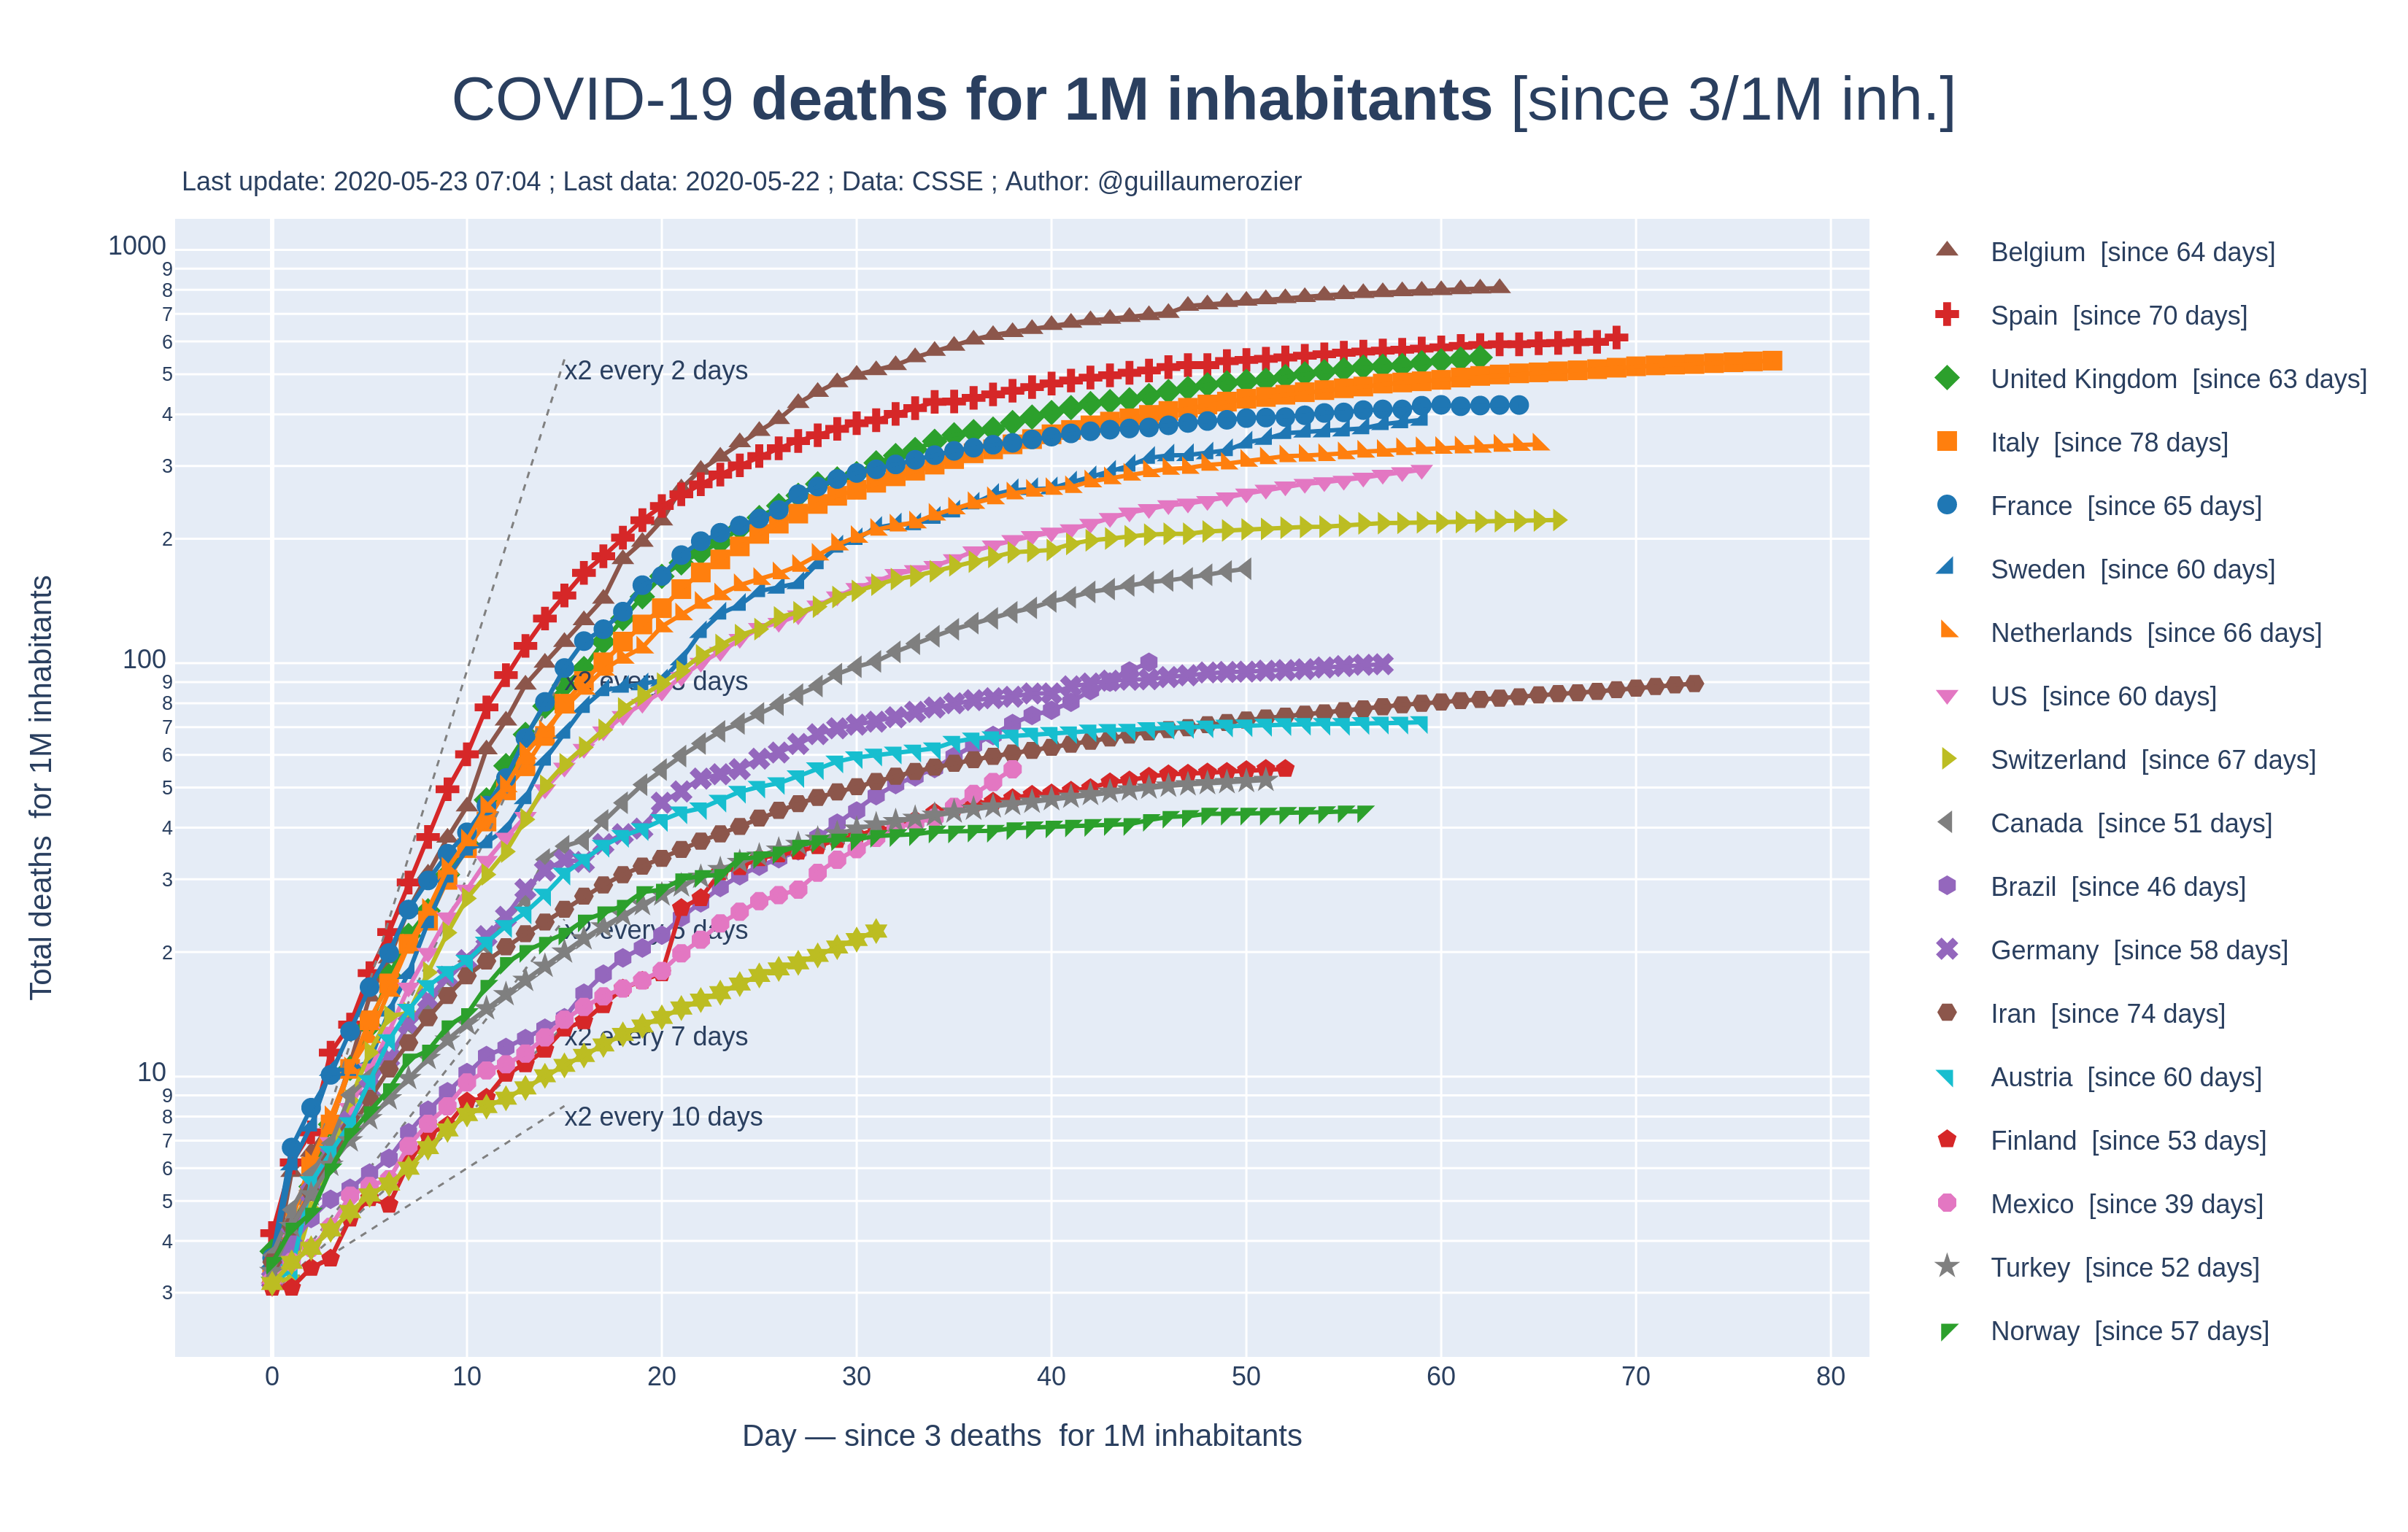
Deaths for 1M inhabitants [since a threshold]\
:arrow_right: Show Graph • Show Graph (log) •Download Image • Download Image (log)\
Same as the second one, but each country is displayed from the day a certain threshold has been reached. This makes it possible to compare the recent increase in the number of cases between countries.
Dashboard (deprecated)
I will do a better one soon…
I created a dashboard where you can find 4 of the charts I generate.
Data Sources
You can find 2 datasets:
- Data downloaded from CSSE. Data come from WHO (World Health Organization).
- INSEE (Institut National des Statistiques et des Études Économiques)
- Santé Publique France.
- Personal data (added manually).
If you have any question or feedback please ask me by email or on Twitter.